Zimbabwean vs Immigrants from Greece In Labor Force | Age 25-29
COMPARE
Zimbabwean
Immigrants from Greece
In Labor Force | Age 25-29
In Labor Force | Age 25-29 Comparison
Zimbabweans
Immigrants from Greece
84.5%
IN LABOR FORCE | AGE 25-29
28.7/ 100
METRIC RATING
191st/ 347
METRIC RANK
85.7%
IN LABOR FORCE | AGE 25-29
99.9/ 100
METRIC RATING
41st/ 347
METRIC RANK
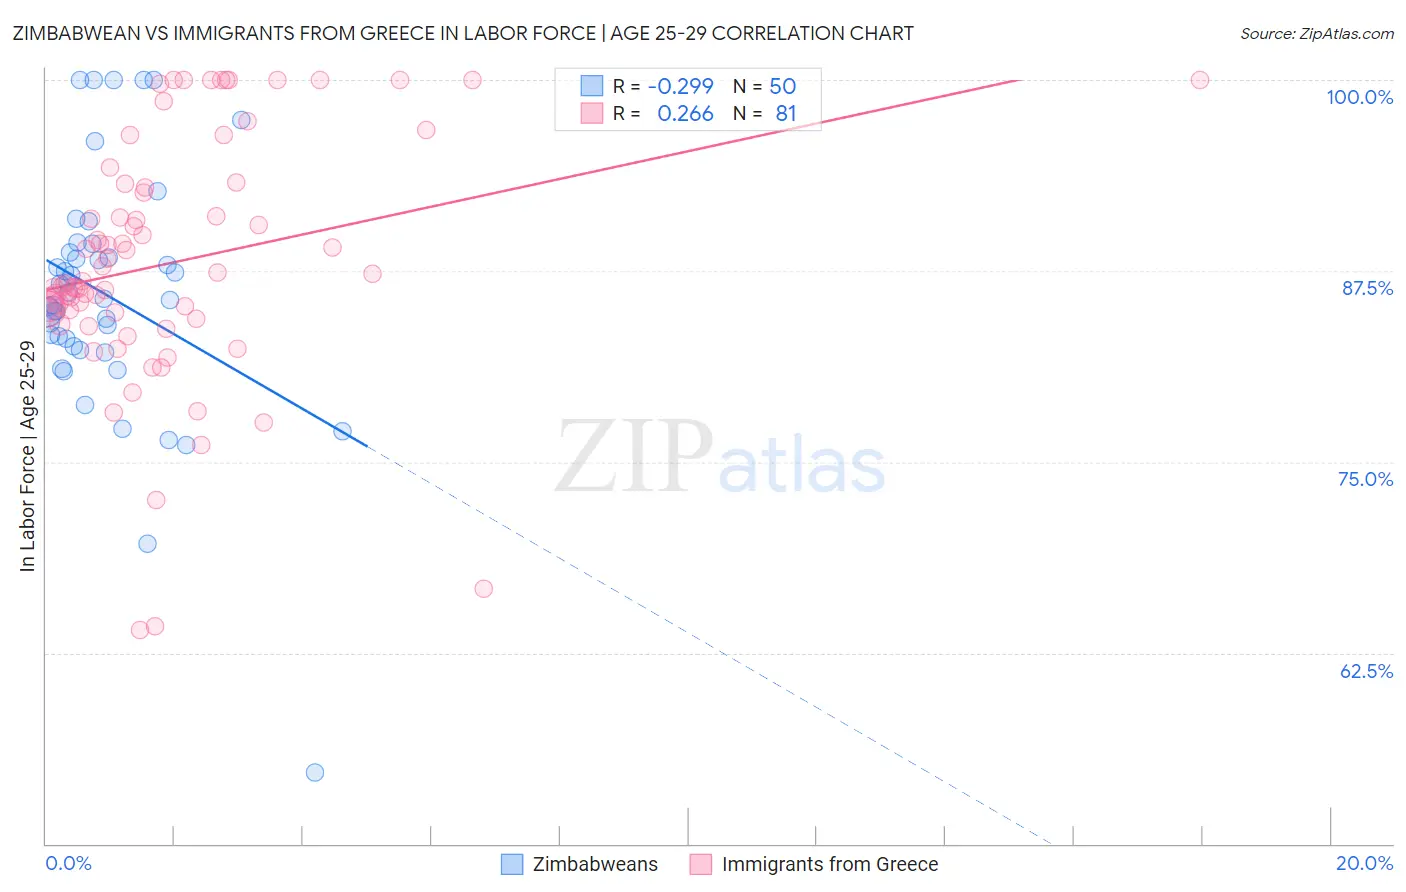
Zimbabwean vs Immigrants from Greece In Labor Force | Age 25-29 Correlation Chart
The statistical analysis conducted on geographies consisting of 69,201,271 people shows a weak negative correlation between the proportion of Zimbabweans and labor force participation rate among population between the ages 25 and 29 in the United States with a correlation coefficient (R) of -0.299 and weighted average of 84.5%. Similarly, the statistical analysis conducted on geographies consisting of 216,855,125 people shows a weak positive correlation between the proportion of Immigrants from Greece and labor force participation rate among population between the ages 25 and 29 in the United States with a correlation coefficient (R) of 0.266 and weighted average of 85.7%, a difference of 1.5%.
In Labor Force | Age 25-29 Correlation Summary
| Measurement | Zimbabwean | Immigrants from Greece |
| Minimum | 54.7% | 64.0% |
| Maximum | 100.0% | 100.0% |
| Range | 45.3% | 36.0% |
| Mean | 85.9% | 88.0% |
| Median | 85.6% | 86.8% |
| Interquartile 25% (IQ1) | 82.6% | 84.6% |
| Interquartile 75% (IQ3) | 88.7% | 93.1% |
| Interquartile Range (IQR) | 6.1% | 8.5% |
| Standard Deviation (Sample) | 8.0% | 8.0% |
| Standard Deviation (Population) | 8.0% | 7.9% |
Similar Demographics by In Labor Force | Age 25-29
Demographics Similar to Zimbabweans by In Labor Force | Age 25-29
In terms of in labor force | age 25-29, the demographic groups most similar to Zimbabweans are Welsh (84.5%, a difference of 0.020%), Moroccan (84.5%, a difference of 0.030%), English (84.5%, a difference of 0.030%), South American Indian (84.5%, a difference of 0.030%), and Immigrants from Ukraine (84.5%, a difference of 0.040%).
| Demographics | Rating | Rank | In Labor Force | Age 25-29 |
| Immigrants | Kuwait | 38.2 /100 | #184 | Fair 84.6% |
| Immigrants | Denmark | 37.0 /100 | #185 | Fair 84.6% |
| Immigrants | Belgium | 35.0 /100 | #186 | Fair 84.6% |
| Immigrants | Portugal | 34.7 /100 | #187 | Fair 84.6% |
| Immigrants | Ukraine | 33.7 /100 | #188 | Fair 84.5% |
| Moroccans | 32.6 /100 | #189 | Fair 84.5% |
| Welsh | 31.1 /100 | #190 | Fair 84.5% |
| Zimbabweans | 28.7 /100 | #191 | Fair 84.5% |
| English | 25.8 /100 | #192 | Fair 84.5% |
| South American Indians | 25.0 /100 | #193 | Fair 84.5% |
| Portuguese | 21.2 /100 | #194 | Fair 84.4% |
| Immigrants | Israel | 20.8 /100 | #195 | Fair 84.4% |
| Immigrants | South Eastern Asia | 19.5 /100 | #196 | Poor 84.4% |
| Tlingit-Haida | 19.3 /100 | #197 | Poor 84.4% |
| Immigrants | Iraq | 19.0 /100 | #198 | Poor 84.4% |
Demographics Similar to Immigrants from Greece by In Labor Force | Age 25-29
In terms of in labor force | age 25-29, the demographic groups most similar to Immigrants from Greece are Immigrants from Albania (85.7%, a difference of 0.010%), Sierra Leonean (85.8%, a difference of 0.030%), Croatian (85.8%, a difference of 0.030%), Immigrants from Eritrea (85.7%, a difference of 0.040%), and Polish (85.8%, a difference of 0.050%).
| Demographics | Rating | Rank | In Labor Force | Age 25-29 |
| Lithuanians | 99.9 /100 | #34 | Exceptional 85.8% |
| Cypriots | 99.9 /100 | #35 | Exceptional 85.8% |
| Immigrants | Nepal | 99.9 /100 | #36 | Exceptional 85.8% |
| Poles | 99.9 /100 | #37 | Exceptional 85.8% |
| Sierra Leoneans | 99.9 /100 | #38 | Exceptional 85.8% |
| Croatians | 99.9 /100 | #39 | Exceptional 85.8% |
| Immigrants | Albania | 99.9 /100 | #40 | Exceptional 85.7% |
| Immigrants | Greece | 99.9 /100 | #41 | Exceptional 85.7% |
| Immigrants | Eritrea | 99.9 /100 | #42 | Exceptional 85.7% |
| Immigrants | India | 99.9 /100 | #43 | Exceptional 85.7% |
| Macedonians | 99.9 /100 | #44 | Exceptional 85.7% |
| Immigrants | Sierra Leone | 99.9 /100 | #45 | Exceptional 85.7% |
| Czechs | 99.8 /100 | #46 | Exceptional 85.6% |
| Turks | 99.8 /100 | #47 | Exceptional 85.6% |
| Italians | 99.8 /100 | #48 | Exceptional 85.6% |