Kiowa vs Immigrants from Greece In Labor Force | Age 25-29
COMPARE
Kiowa
Immigrants from Greece
In Labor Force | Age 25-29
In Labor Force | Age 25-29 Comparison
Kiowa
Immigrants from Greece
81.6%
IN LABOR FORCE | AGE 25-29
0.0/ 100
METRIC RATING
322nd/ 347
METRIC RANK
85.7%
IN LABOR FORCE | AGE 25-29
99.9/ 100
METRIC RATING
41st/ 347
METRIC RANK
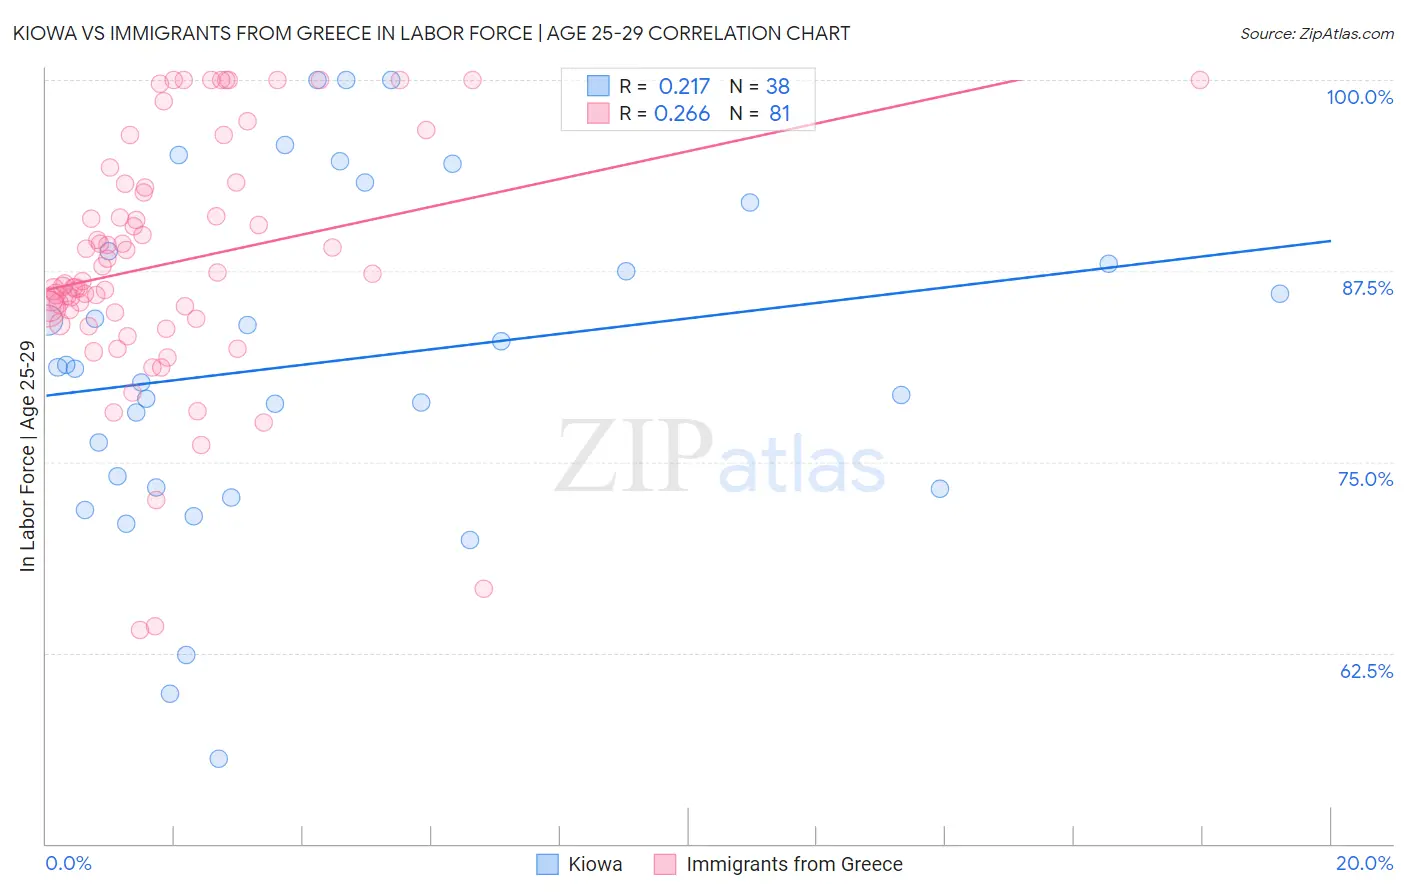
Kiowa vs Immigrants from Greece In Labor Force | Age 25-29 Correlation Chart
The statistical analysis conducted on geographies consisting of 56,097,526 people shows a weak positive correlation between the proportion of Kiowa and labor force participation rate among population between the ages 25 and 29 in the United States with a correlation coefficient (R) of 0.217 and weighted average of 81.6%. Similarly, the statistical analysis conducted on geographies consisting of 216,855,125 people shows a weak positive correlation between the proportion of Immigrants from Greece and labor force participation rate among population between the ages 25 and 29 in the United States with a correlation coefficient (R) of 0.266 and weighted average of 85.7%, a difference of 5.1%.
In Labor Force | Age 25-29 Correlation Summary
| Measurement | Kiowa | Immigrants from Greece |
| Minimum | 55.6% | 64.0% |
| Maximum | 100.0% | 100.0% |
| Range | 44.4% | 36.0% |
| Mean | 81.6% | 88.0% |
| Median | 81.1% | 86.8% |
| Interquartile 25% (IQ1) | 73.3% | 84.6% |
| Interquartile 75% (IQ3) | 88.8% | 93.1% |
| Interquartile Range (IQR) | 15.5% | 8.5% |
| Standard Deviation (Sample) | 11.0% | 8.0% |
| Standard Deviation (Population) | 10.8% | 7.9% |
Similar Demographics by In Labor Force | Age 25-29
Demographics Similar to Kiowa by In Labor Force | Age 25-29
In terms of in labor force | age 25-29, the demographic groups most similar to Kiowa are Shoshone (81.6%, a difference of 0.010%), Alaska Native (81.6%, a difference of 0.050%), Colville (81.6%, a difference of 0.070%), Seminole (81.7%, a difference of 0.12%), and Comanche (81.9%, a difference of 0.33%).
| Demographics | Rating | Rank | In Labor Force | Age 25-29 |
| Immigrants | Mexico | 0.0 /100 | #315 | Tragic 82.0% |
| Mexicans | 0.0 /100 | #316 | Tragic 81.9% |
| Chickasaw | 0.0 /100 | #317 | Tragic 81.9% |
| Comanche | 0.0 /100 | #318 | Tragic 81.9% |
| Seminole | 0.0 /100 | #319 | Tragic 81.7% |
| Colville | 0.0 /100 | #320 | Tragic 81.6% |
| Shoshone | 0.0 /100 | #321 | Tragic 81.6% |
| Kiowa | 0.0 /100 | #322 | Tragic 81.6% |
| Alaska Natives | 0.0 /100 | #323 | Tragic 81.6% |
| Houma | 0.0 /100 | #324 | Tragic 81.2% |
| Dutch West Indians | 0.0 /100 | #325 | Tragic 81.1% |
| Choctaw | 0.0 /100 | #326 | Tragic 81.0% |
| Ute | 0.0 /100 | #327 | Tragic 80.8% |
| Creek | 0.0 /100 | #328 | Tragic 80.7% |
| Yakama | 0.0 /100 | #329 | Tragic 80.6% |
Demographics Similar to Immigrants from Greece by In Labor Force | Age 25-29
In terms of in labor force | age 25-29, the demographic groups most similar to Immigrants from Greece are Immigrants from Albania (85.7%, a difference of 0.010%), Sierra Leonean (85.8%, a difference of 0.030%), Croatian (85.8%, a difference of 0.030%), Immigrants from Eritrea (85.7%, a difference of 0.040%), and Polish (85.8%, a difference of 0.050%).
| Demographics | Rating | Rank | In Labor Force | Age 25-29 |
| Lithuanians | 99.9 /100 | #34 | Exceptional 85.8% |
| Cypriots | 99.9 /100 | #35 | Exceptional 85.8% |
| Immigrants | Nepal | 99.9 /100 | #36 | Exceptional 85.8% |
| Poles | 99.9 /100 | #37 | Exceptional 85.8% |
| Sierra Leoneans | 99.9 /100 | #38 | Exceptional 85.8% |
| Croatians | 99.9 /100 | #39 | Exceptional 85.8% |
| Immigrants | Albania | 99.9 /100 | #40 | Exceptional 85.7% |
| Immigrants | Greece | 99.9 /100 | #41 | Exceptional 85.7% |
| Immigrants | Eritrea | 99.9 /100 | #42 | Exceptional 85.7% |
| Immigrants | India | 99.9 /100 | #43 | Exceptional 85.7% |
| Macedonians | 99.9 /100 | #44 | Exceptional 85.7% |
| Immigrants | Sierra Leone | 99.9 /100 | #45 | Exceptional 85.7% |
| Czechs | 99.8 /100 | #46 | Exceptional 85.6% |
| Turks | 99.8 /100 | #47 | Exceptional 85.6% |
| Italians | 99.8 /100 | #48 | Exceptional 85.6% |