Icelander vs Dutch In Labor Force | Age 45-54
COMPARE
Icelander
Dutch
In Labor Force | Age 45-54
In Labor Force | Age 45-54 Comparison
Icelanders
Dutch
82.8%
IN LABOR FORCE | AGE 45-54
51.8/ 100
METRIC RATING
172nd/ 347
METRIC RANK
82.8%
IN LABOR FORCE | AGE 45-54
61.7/ 100
METRIC RATING
163rd/ 347
METRIC RANK
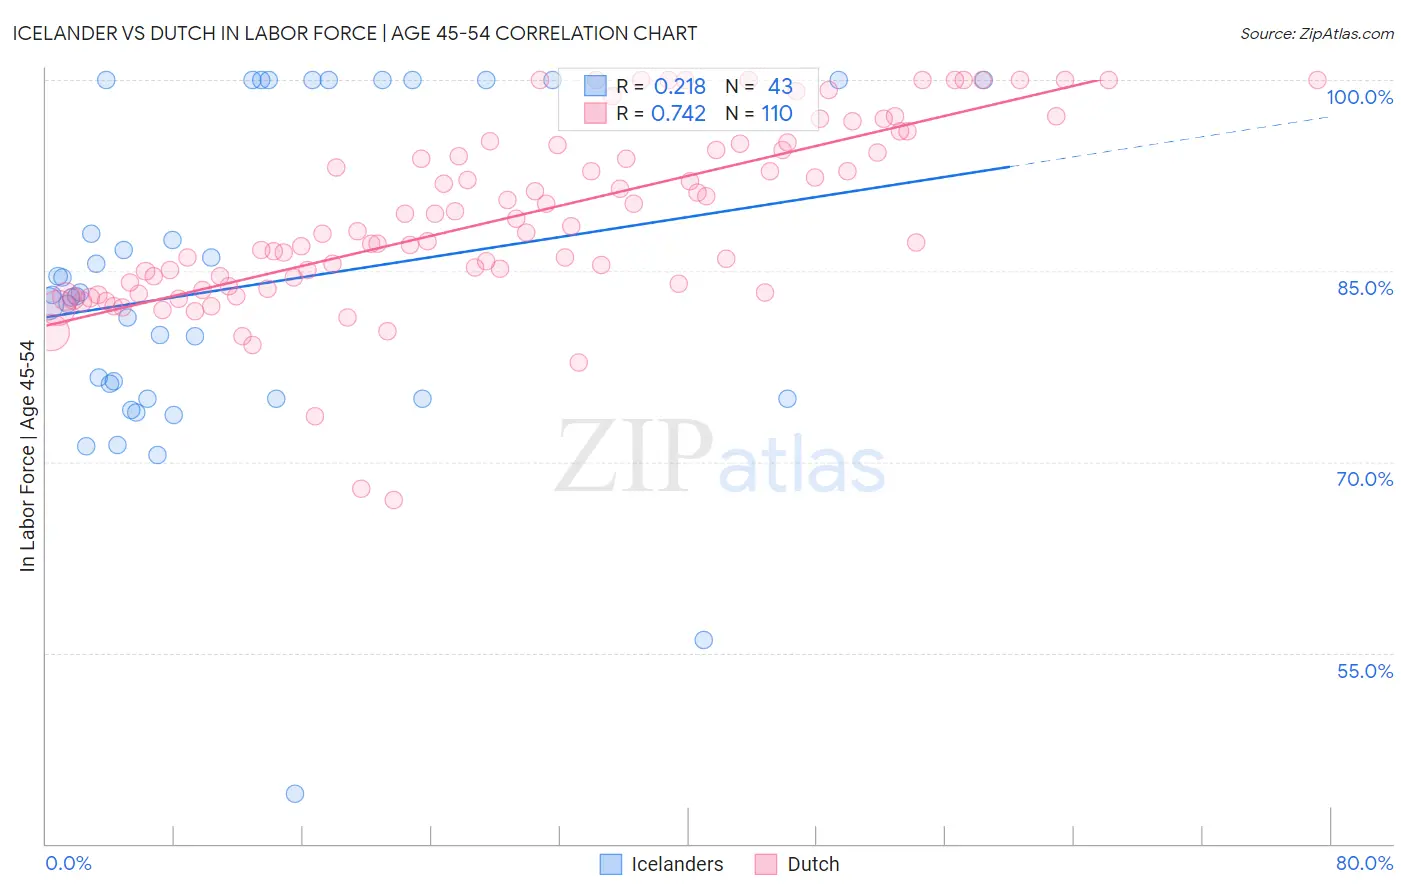
Icelander vs Dutch In Labor Force | Age 45-54 Correlation Chart
The statistical analysis conducted on geographies consisting of 159,615,670 people shows a weak positive correlation between the proportion of Icelanders and labor force participation rate among population between the ages 45 and 54 in the United States with a correlation coefficient (R) of 0.218 and weighted average of 82.8%. Similarly, the statistical analysis conducted on geographies consisting of 553,744,629 people shows a strong positive correlation between the proportion of Dutch and labor force participation rate among population between the ages 45 and 54 in the United States with a correlation coefficient (R) of 0.742 and weighted average of 82.8%, a difference of 0.090%.
In Labor Force | Age 45-54 Correlation Summary
| Measurement | Icelander | Dutch |
| Minimum | 43.9% | 67.0% |
| Maximum | 100.0% | 100.0% |
| Range | 56.1% | 33.0% |
| Mean | 83.8% | 89.2% |
| Median | 83.0% | 88.1% |
| Interquartile 25% (IQ1) | 75.0% | 83.8% |
| Interquartile 75% (IQ3) | 100.0% | 94.9% |
| Interquartile Range (IQR) | 25.0% | 11.1% |
| Standard Deviation (Sample) | 12.8% | 7.1% |
| Standard Deviation (Population) | 12.6% | 7.1% |
Demographics Similar to Icelanders and Dutch by In Labor Force | Age 45-54
In terms of in labor force | age 45-54, the demographic groups most similar to Icelanders are Pakistani (82.8%, a difference of 0.010%), Immigrants from Zaire (82.8%, a difference of 0.010%), Nicaraguan (82.8%, a difference of 0.010%), Immigrants from Western Africa (82.8%, a difference of 0.020%), and Costa Rican (82.8%, a difference of 0.020%). Similarly, the demographic groups most similar to Dutch are South American Indian (82.9%, a difference of 0.0%), Haitian (82.8%, a difference of 0.0%), German Russian (82.8%, a difference of 0.0%), Laotian (82.9%, a difference of 0.010%), and Immigrants from Sudan (82.8%, a difference of 0.020%).
| Demographics | Rating | Rank | In Labor Force | Age 45-54 |
| Immigrants | Australia | 68.2 /100 | #157 | Good 82.9% |
| Immigrants | Southern Europe | 67.8 /100 | #158 | Good 82.9% |
| Immigrants | Austria | 64.6 /100 | #159 | Good 82.9% |
| Laotians | 62.8 /100 | #160 | Good 82.9% |
| South American Indians | 62.2 /100 | #161 | Good 82.9% |
| Haitians | 61.8 /100 | #162 | Good 82.8% |
| Dutch | 61.7 /100 | #163 | Good 82.8% |
| German Russians | 61.3 /100 | #164 | Good 82.8% |
| Immigrants | Sudan | 59.9 /100 | #165 | Average 82.8% |
| Immigrants | South Eastern Asia | 57.4 /100 | #166 | Average 82.8% |
| Swiss | 56.5 /100 | #167 | Average 82.8% |
| Immigrants | South Africa | 55.8 /100 | #168 | Average 82.8% |
| Immigrants | Western Africa | 54.1 /100 | #169 | Average 82.8% |
| Pakistanis | 53.2 /100 | #170 | Average 82.8% |
| Immigrants | Zaire | 52.9 /100 | #171 | Average 82.8% |
| Icelanders | 51.8 /100 | #172 | Average 82.8% |
| Nicaraguans | 50.3 /100 | #173 | Average 82.8% |
| Costa Ricans | 50.0 /100 | #174 | Average 82.8% |
| Immigrants | Liberia | 47.9 /100 | #175 | Average 82.7% |
| Northern Europeans | 46.9 /100 | #176 | Average 82.7% |
| Immigrants | Nicaragua | 44.6 /100 | #177 | Average 82.7% |