Immigrants from Kenya vs Dutch In Labor Force | Age 45-54
COMPARE
Immigrants from Kenya
Dutch
In Labor Force | Age 45-54
In Labor Force | Age 45-54 Comparison
Immigrants from Kenya
Dutch
83.5%
IN LABOR FORCE | AGE 45-54
97.9/ 100
METRIC RATING
64th/ 347
METRIC RANK
82.8%
IN LABOR FORCE | AGE 45-54
61.7/ 100
METRIC RATING
163rd/ 347
METRIC RANK
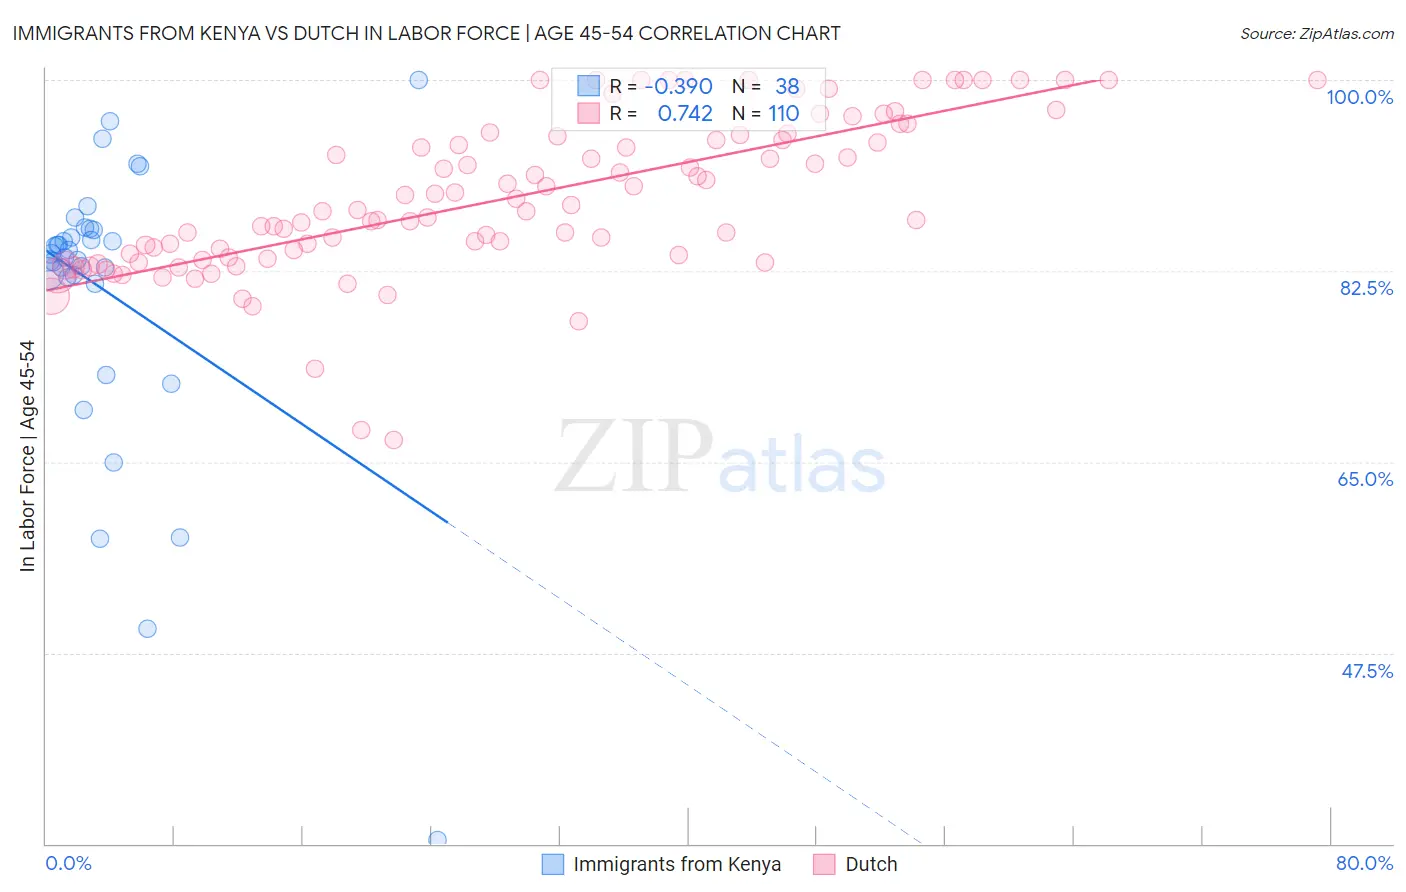
Immigrants from Kenya vs Dutch In Labor Force | Age 45-54 Correlation Chart
The statistical analysis conducted on geographies consisting of 217,994,383 people shows a mild negative correlation between the proportion of Immigrants from Kenya and labor force participation rate among population between the ages 45 and 54 in the United States with a correlation coefficient (R) of -0.390 and weighted average of 83.5%. Similarly, the statistical analysis conducted on geographies consisting of 553,744,629 people shows a strong positive correlation between the proportion of Dutch and labor force participation rate among population between the ages 45 and 54 in the United States with a correlation coefficient (R) of 0.742 and weighted average of 82.8%, a difference of 0.74%.
In Labor Force | Age 45-54 Correlation Summary
| Measurement | Immigrants from Kenya | Dutch |
| Minimum | 30.4% | 67.0% |
| Maximum | 100.0% | 100.0% |
| Range | 69.6% | 33.0% |
| Mean | 80.5% | 89.2% |
| Median | 83.9% | 88.1% |
| Interquartile 25% (IQ1) | 81.9% | 83.8% |
| Interquartile 75% (IQ3) | 86.3% | 94.9% |
| Interquartile Range (IQR) | 4.4% | 11.1% |
| Standard Deviation (Sample) | 13.3% | 7.1% |
| Standard Deviation (Population) | 13.1% | 7.1% |
Similar Demographics by In Labor Force | Age 45-54
Demographics Similar to Immigrants from Kenya by In Labor Force | Age 45-54
In terms of in labor force | age 45-54, the demographic groups most similar to Immigrants from Kenya are Afghan (83.5%, a difference of 0.0%), Egyptian (83.5%, a difference of 0.0%), Immigrants from Taiwan (83.5%, a difference of 0.010%), Asian (83.4%, a difference of 0.020%), and Chilean (83.4%, a difference of 0.020%).
| Demographics | Rating | Rank | In Labor Force | Age 45-54 |
| Paraguayans | 98.5 /100 | #57 | Exceptional 83.5% |
| Eastern Europeans | 98.5 /100 | #58 | Exceptional 83.5% |
| Bhutanese | 98.3 /100 | #59 | Exceptional 83.5% |
| Carpatho Rusyns | 98.3 /100 | #60 | Exceptional 83.5% |
| Filipinos | 98.3 /100 | #61 | Exceptional 83.5% |
| Immigrants | Taiwan | 98.0 /100 | #62 | Exceptional 83.5% |
| Afghans | 97.9 /100 | #63 | Exceptional 83.5% |
| Immigrants | Kenya | 97.9 /100 | #64 | Exceptional 83.5% |
| Egyptians | 97.9 /100 | #65 | Exceptional 83.5% |
| Asians | 97.7 /100 | #66 | Exceptional 83.4% |
| Chileans | 97.7 /100 | #67 | Exceptional 83.4% |
| Immigrants | Colombia | 97.6 /100 | #68 | Exceptional 83.4% |
| Taiwanese | 97.5 /100 | #69 | Exceptional 83.4% |
| Immigrants | Latvia | 97.4 /100 | #70 | Exceptional 83.4% |
| Colombians | 97.3 /100 | #71 | Exceptional 83.4% |
Demographics Similar to Dutch by In Labor Force | Age 45-54
In terms of in labor force | age 45-54, the demographic groups most similar to Dutch are South American Indian (82.9%, a difference of 0.0%), Haitian (82.8%, a difference of 0.0%), German Russian (82.8%, a difference of 0.0%), Laotian (82.9%, a difference of 0.010%), and Immigrants from Sudan (82.8%, a difference of 0.020%).
| Demographics | Rating | Rank | In Labor Force | Age 45-54 |
| Immigrants | Saudi Arabia | 68.8 /100 | #156 | Good 82.9% |
| Immigrants | Australia | 68.2 /100 | #157 | Good 82.9% |
| Immigrants | Southern Europe | 67.8 /100 | #158 | Good 82.9% |
| Immigrants | Austria | 64.6 /100 | #159 | Good 82.9% |
| Laotians | 62.8 /100 | #160 | Good 82.9% |
| South American Indians | 62.2 /100 | #161 | Good 82.9% |
| Haitians | 61.8 /100 | #162 | Good 82.8% |
| Dutch | 61.7 /100 | #163 | Good 82.8% |
| German Russians | 61.3 /100 | #164 | Good 82.8% |
| Immigrants | Sudan | 59.9 /100 | #165 | Average 82.8% |
| Immigrants | South Eastern Asia | 57.4 /100 | #166 | Average 82.8% |
| Swiss | 56.5 /100 | #167 | Average 82.8% |
| Immigrants | South Africa | 55.8 /100 | #168 | Average 82.8% |
| Immigrants | Western Africa | 54.1 /100 | #169 | Average 82.8% |
| Pakistanis | 53.2 /100 | #170 | Average 82.8% |