Turkish vs Dutch In Labor Force | Age 45-54
COMPARE
Turkish
Dutch
In Labor Force | Age 45-54
In Labor Force | Age 45-54 Comparison
Turks
Dutch
83.8%
IN LABOR FORCE | AGE 45-54
99.7/ 100
METRIC RATING
32nd/ 347
METRIC RANK
82.8%
IN LABOR FORCE | AGE 45-54
61.7/ 100
METRIC RATING
163rd/ 347
METRIC RANK
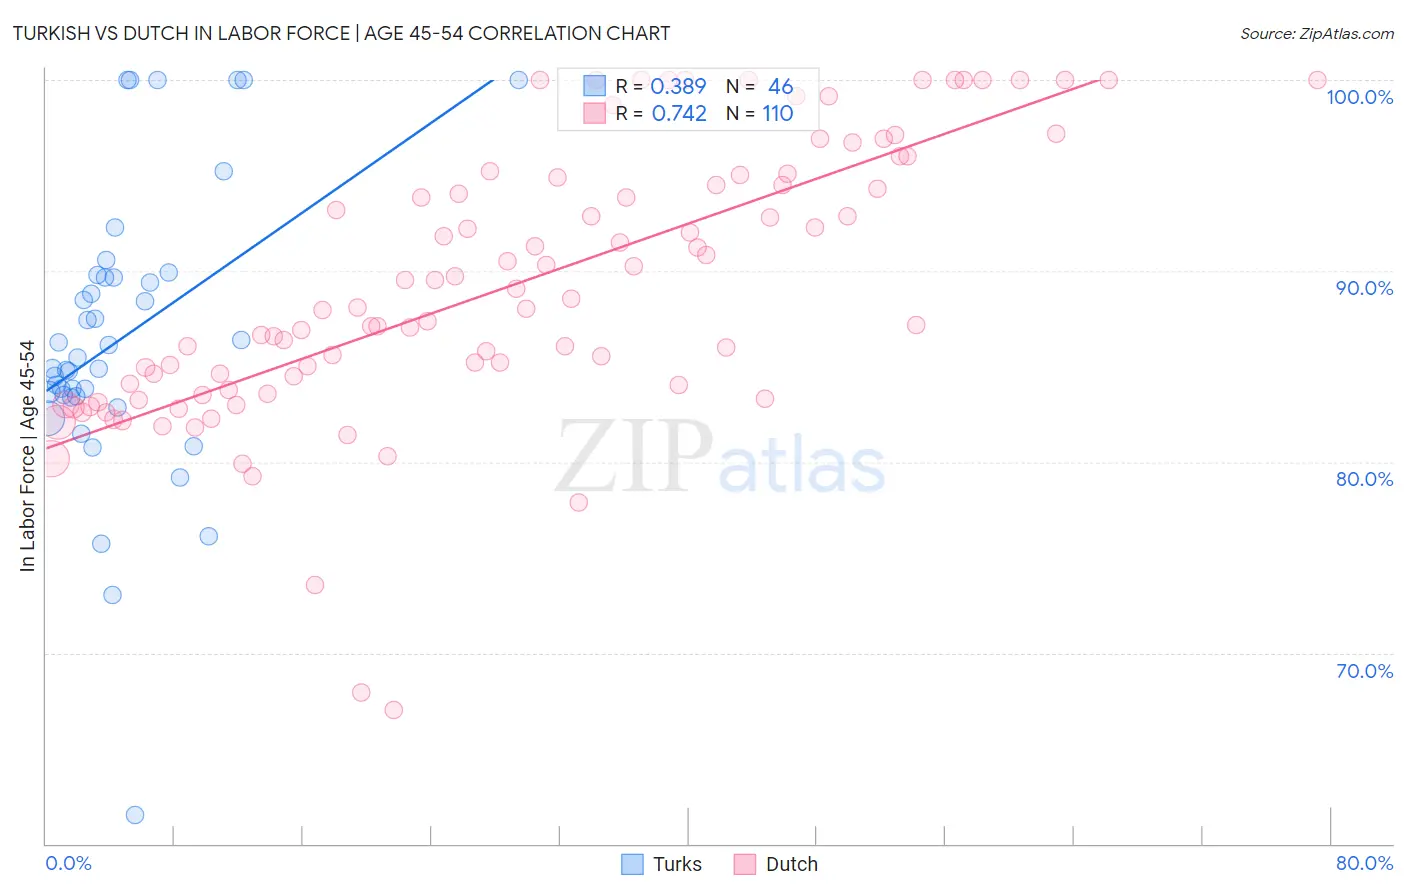
Turkish vs Dutch In Labor Force | Age 45-54 Correlation Chart
The statistical analysis conducted on geographies consisting of 271,698,387 people shows a mild positive correlation between the proportion of Turks and labor force participation rate among population between the ages 45 and 54 in the United States with a correlation coefficient (R) of 0.389 and weighted average of 83.8%. Similarly, the statistical analysis conducted on geographies consisting of 553,744,629 people shows a strong positive correlation between the proportion of Dutch and labor force participation rate among population between the ages 45 and 54 in the United States with a correlation coefficient (R) of 0.742 and weighted average of 82.8%, a difference of 1.1%.
In Labor Force | Age 45-54 Correlation Summary
| Measurement | Turkish | Dutch |
| Minimum | 61.5% | 67.0% |
| Maximum | 100.0% | 100.0% |
| Range | 38.5% | 33.0% |
| Mean | 86.5% | 89.2% |
| Median | 85.2% | 88.1% |
| Interquartile 25% (IQ1) | 83.4% | 83.8% |
| Interquartile 75% (IQ3) | 89.6% | 94.9% |
| Interquartile Range (IQR) | 6.2% | 11.1% |
| Standard Deviation (Sample) | 7.6% | 7.1% |
| Standard Deviation (Population) | 7.5% | 7.1% |
Similar Demographics by In Labor Force | Age 45-54
Demographics Similar to Turks by In Labor Force | Age 45-54
In terms of in labor force | age 45-54, the demographic groups most similar to Turks are Latvian (83.8%, a difference of 0.010%), Immigrants from Eritrea (83.8%, a difference of 0.020%), Immigrants from Bulgaria (83.8%, a difference of 0.040%), Immigrants from Pakistan (83.8%, a difference of 0.060%), and Immigrants from Lithuania (83.9%, a difference of 0.080%).
| Demographics | Rating | Rank | In Labor Force | Age 45-54 |
| Immigrants | North Macedonia | 99.8 /100 | #25 | Exceptional 83.9% |
| Immigrants | Serbia | 99.8 /100 | #26 | Exceptional 83.9% |
| Immigrants | Brazil | 99.8 /100 | #27 | Exceptional 83.9% |
| Immigrants | Lithuania | 99.8 /100 | #28 | Exceptional 83.9% |
| Immigrants | Pakistan | 99.7 /100 | #29 | Exceptional 83.8% |
| Immigrants | Bulgaria | 99.7 /100 | #30 | Exceptional 83.8% |
| Immigrants | Eritrea | 99.7 /100 | #31 | Exceptional 83.8% |
| Turks | 99.7 /100 | #32 | Exceptional 83.8% |
| Latvians | 99.7 /100 | #33 | Exceptional 83.8% |
| Kenyans | 99.5 /100 | #34 | Exceptional 83.7% |
| Brazilians | 99.5 /100 | #35 | Exceptional 83.7% |
| Ugandans | 99.5 /100 | #36 | Exceptional 83.7% |
| Swedes | 99.4 /100 | #37 | Exceptional 83.7% |
| Immigrants | Venezuela | 99.4 /100 | #38 | Exceptional 83.7% |
| Immigrants | Cuba | 99.4 /100 | #39 | Exceptional 83.7% |
Demographics Similar to Dutch by In Labor Force | Age 45-54
In terms of in labor force | age 45-54, the demographic groups most similar to Dutch are South American Indian (82.9%, a difference of 0.0%), Haitian (82.8%, a difference of 0.0%), German Russian (82.8%, a difference of 0.0%), Laotian (82.9%, a difference of 0.010%), and Immigrants from Sudan (82.8%, a difference of 0.020%).
| Demographics | Rating | Rank | In Labor Force | Age 45-54 |
| Immigrants | Saudi Arabia | 68.8 /100 | #156 | Good 82.9% |
| Immigrants | Australia | 68.2 /100 | #157 | Good 82.9% |
| Immigrants | Southern Europe | 67.8 /100 | #158 | Good 82.9% |
| Immigrants | Austria | 64.6 /100 | #159 | Good 82.9% |
| Laotians | 62.8 /100 | #160 | Good 82.9% |
| South American Indians | 62.2 /100 | #161 | Good 82.9% |
| Haitians | 61.8 /100 | #162 | Good 82.8% |
| Dutch | 61.7 /100 | #163 | Good 82.8% |
| German Russians | 61.3 /100 | #164 | Good 82.8% |
| Immigrants | Sudan | 59.9 /100 | #165 | Average 82.8% |
| Immigrants | South Eastern Asia | 57.4 /100 | #166 | Average 82.8% |
| Swiss | 56.5 /100 | #167 | Average 82.8% |
| Immigrants | South Africa | 55.8 /100 | #168 | Average 82.8% |
| Immigrants | Western Africa | 54.1 /100 | #169 | Average 82.8% |
| Pakistanis | 53.2 /100 | #170 | Average 82.8% |