Icelander vs Dutch Unemployment Among Women with Children Under 6 years
COMPARE
Icelander
Dutch
Unemployment Among Women with Children Under 6 years
Unemployment Among Women with Children Under 6 years Comparison
Icelanders
Dutch
6.9%
UNEMPLOYMENT AMONG WOMEN WITH CHILDREN UNDER 6 YEARS
99.8/ 100
METRIC RATING
57th/ 347
METRIC RANK
8.1%
UNEMPLOYMENT AMONG WOMEN WITH CHILDREN UNDER 6 YEARS
2.5/ 100
METRIC RATING
242nd/ 347
METRIC RANK
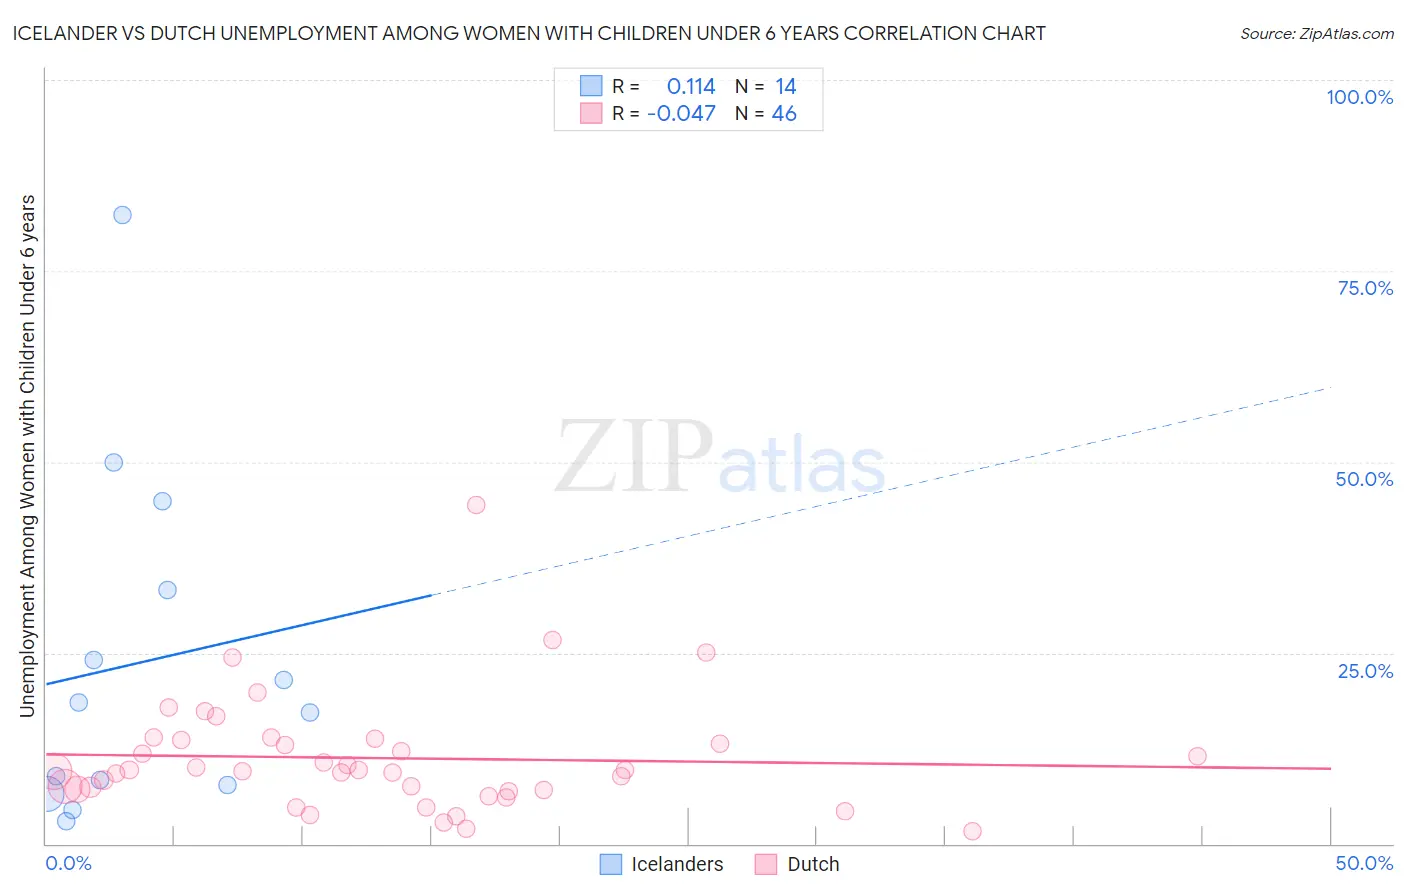
Icelander vs Dutch Unemployment Among Women with Children Under 6 years Correlation Chart
The statistical analysis conducted on geographies consisting of 135,447,432 people shows a poor positive correlation between the proportion of Icelanders and unemployment rate among women with children under the age of 6 in the United States with a correlation coefficient (R) of 0.114 and weighted average of 6.9%. Similarly, the statistical analysis conducted on geographies consisting of 369,089,937 people shows no correlation between the proportion of Dutch and unemployment rate among women with children under the age of 6 in the United States with a correlation coefficient (R) of -0.047 and weighted average of 8.1%, a difference of 18.4%.
Unemployment Among Women with Children Under 6 years Correlation Summary
| Measurement | Icelander | Dutch |
| Minimum | 3.0% | 1.7% |
| Maximum | 82.3% | 44.4% |
| Range | 79.3% | 42.7% |
| Mean | 23.6% | 11.2% |
| Median | 17.8% | 9.6% |
| Interquartile 25% (IQ1) | 7.7% | 7.0% |
| Interquartile 75% (IQ3) | 33.3% | 13.7% |
| Interquartile Range (IQR) | 25.6% | 6.7% |
| Standard Deviation (Sample) | 22.4% | 7.6% |
| Standard Deviation (Population) | 21.6% | 7.5% |
Similar Demographics by Unemployment Among Women with Children Under 6 years
Demographics Similar to Icelanders by Unemployment Among Women with Children Under 6 years
In terms of unemployment among women with children under 6 years, the demographic groups most similar to Icelanders are Immigrants from Ethiopia (6.9%, a difference of 0.010%), Immigrants from Ukraine (6.8%, a difference of 0.11%), Immigrants from Turkey (6.9%, a difference of 0.23%), Immigrants from Serbia (6.9%, a difference of 0.29%), and Immigrants from Sri Lanka (6.9%, a difference of 0.37%).
| Demographics | Rating | Rank | Unemployment Among Women with Children Under 6 years |
| Immigrants | Ireland | 99.9 /100 | #50 | Exceptional 6.8% |
| Ethiopians | 99.9 /100 | #51 | Exceptional 6.8% |
| Immigrants | Iran | 99.9 /100 | #52 | Exceptional 6.8% |
| Chinese | 99.9 /100 | #53 | Exceptional 6.8% |
| Immigrants | Latvia | 99.9 /100 | #54 | Exceptional 6.8% |
| Immigrants | Ukraine | 99.8 /100 | #55 | Exceptional 6.8% |
| Immigrants | Ethiopia | 99.8 /100 | #56 | Exceptional 6.9% |
| Icelanders | 99.8 /100 | #57 | Exceptional 6.9% |
| Immigrants | Turkey | 99.8 /100 | #58 | Exceptional 6.9% |
| Immigrants | Serbia | 99.8 /100 | #59 | Exceptional 6.9% |
| Immigrants | Sri Lanka | 99.8 /100 | #60 | Exceptional 6.9% |
| Immigrants | France | 99.7 /100 | #61 | Exceptional 6.9% |
| Somalis | 99.7 /100 | #62 | Exceptional 6.9% |
| Maltese | 99.7 /100 | #63 | Exceptional 6.9% |
| Tongans | 99.7 /100 | #64 | Exceptional 6.9% |
Demographics Similar to Dutch by Unemployment Among Women with Children Under 6 years
In terms of unemployment among women with children under 6 years, the demographic groups most similar to Dutch are Liberian (8.1%, a difference of 0.060%), Immigrants from El Salvador (8.1%, a difference of 0.080%), Irish (8.1%, a difference of 0.16%), Immigrants from Middle Africa (8.1%, a difference of 0.42%), and Hawaiian (8.2%, a difference of 0.56%).
| Demographics | Rating | Rank | Unemployment Among Women with Children Under 6 years |
| Comanche | 4.3 /100 | #235 | Tragic 8.0% |
| Immigrants | Barbados | 4.2 /100 | #236 | Tragic 8.0% |
| Immigrants | Costa Rica | 4.1 /100 | #237 | Tragic 8.0% |
| Immigrants | Middle Africa | 3.2 /100 | #238 | Tragic 8.1% |
| Irish | 2.7 /100 | #239 | Tragic 8.1% |
| Immigrants | El Salvador | 2.6 /100 | #240 | Tragic 8.1% |
| Liberians | 2.6 /100 | #241 | Tragic 8.1% |
| Dutch | 2.5 /100 | #242 | Tragic 8.1% |
| Hawaiians | 1.8 /100 | #243 | Tragic 8.2% |
| French | 1.7 /100 | #244 | Tragic 8.2% |
| Native Hawaiians | 1.7 /100 | #245 | Tragic 8.2% |
| Central Americans | 1.4 /100 | #246 | Tragic 8.2% |
| German Russians | 1.2 /100 | #247 | Tragic 8.2% |
| Immigrants | Western Africa | 1.1 /100 | #248 | Tragic 8.2% |
| Immigrants | Sierra Leone | 1.1 /100 | #249 | Tragic 8.2% |