Bermudan vs Dutch In Labor Force | Age 45-54
COMPARE
Bermudan
Dutch
In Labor Force | Age 45-54
In Labor Force | Age 45-54 Comparison
Bermudans
Dutch
83.1%
IN LABOR FORCE | AGE 45-54
88.0/ 100
METRIC RATING
124th/ 347
METRIC RANK
82.8%
IN LABOR FORCE | AGE 45-54
61.7/ 100
METRIC RATING
163rd/ 347
METRIC RANK
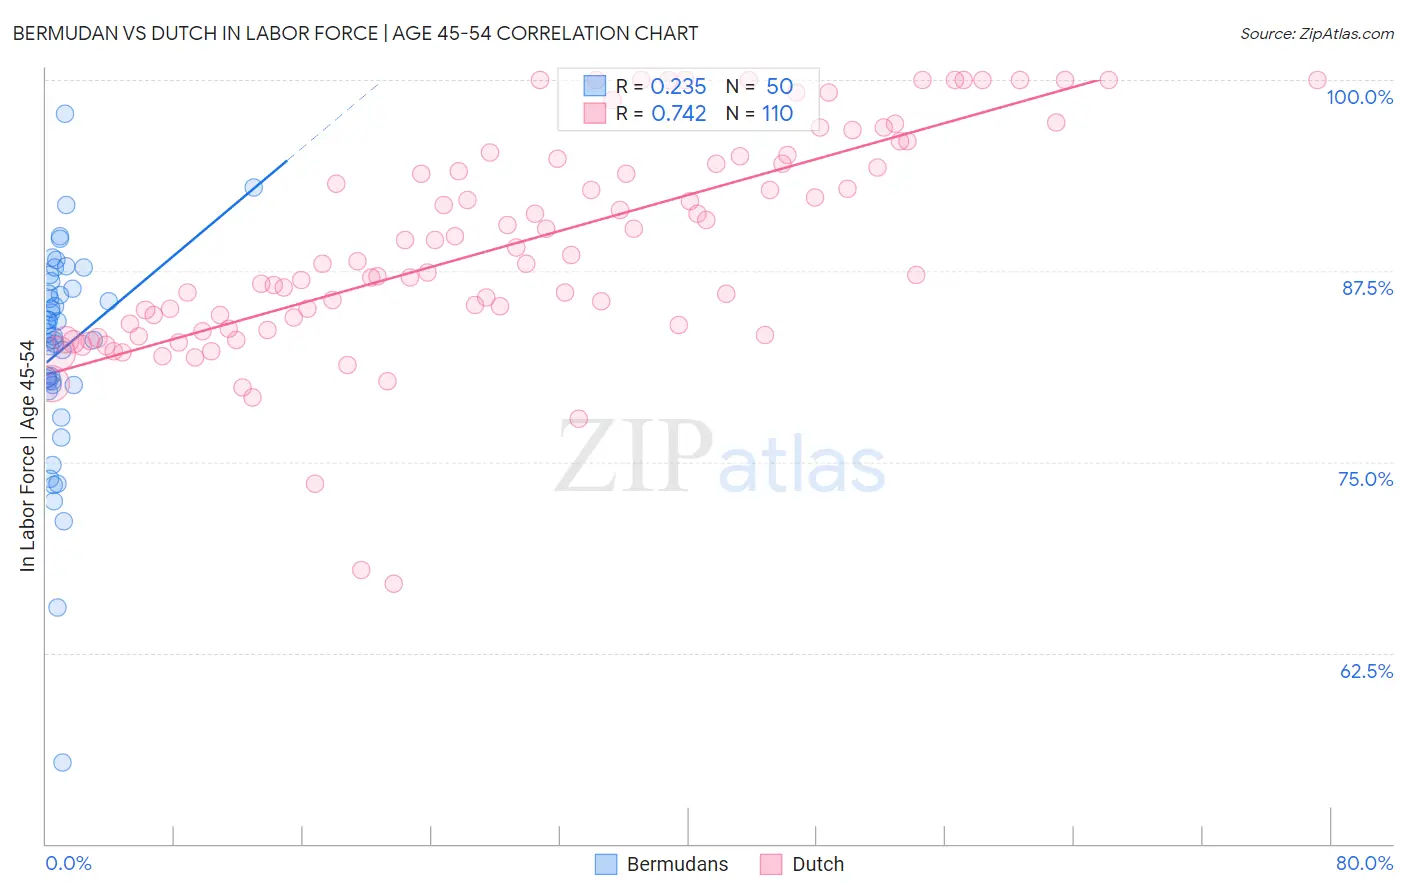
Bermudan vs Dutch In Labor Force | Age 45-54 Correlation Chart
The statistical analysis conducted on geographies consisting of 55,715,223 people shows a weak positive correlation between the proportion of Bermudans and labor force participation rate among population between the ages 45 and 54 in the United States with a correlation coefficient (R) of 0.235 and weighted average of 83.1%. Similarly, the statistical analysis conducted on geographies consisting of 553,744,629 people shows a strong positive correlation between the proportion of Dutch and labor force participation rate among population between the ages 45 and 54 in the United States with a correlation coefficient (R) of 0.742 and weighted average of 82.8%, a difference of 0.33%.
In Labor Force | Age 45-54 Correlation Summary
| Measurement | Bermudan | Dutch |
| Minimum | 55.3% | 67.0% |
| Maximum | 97.8% | 100.0% |
| Range | 42.5% | 33.0% |
| Mean | 82.3% | 89.2% |
| Median | 83.3% | 88.1% |
| Interquartile 25% (IQ1) | 80.0% | 83.8% |
| Interquartile 75% (IQ3) | 86.3% | 94.9% |
| Interquartile Range (IQR) | 6.3% | 11.1% |
| Standard Deviation (Sample) | 7.1% | 7.1% |
| Standard Deviation (Population) | 7.0% | 7.1% |
Similar Demographics by In Labor Force | Age 45-54
Demographics Similar to Bermudans by In Labor Force | Age 45-54
In terms of in labor force | age 45-54, the demographic groups most similar to Bermudans are Tongan (83.1%, a difference of 0.0%), Immigrants from Vietnam (83.1%, a difference of 0.020%), Immigrants from Iran (83.1%, a difference of 0.020%), Uruguayan (83.1%, a difference of 0.030%), and Immigrants from Belgium (83.1%, a difference of 0.030%).
| Demographics | Rating | Rank | In Labor Force | Age 45-54 |
| Immigrants | China | 90.9 /100 | #117 | Exceptional 83.2% |
| Immigrants | Europe | 90.7 /100 | #118 | Exceptional 83.2% |
| Immigrants | Uruguay | 90.2 /100 | #119 | Exceptional 83.2% |
| Immigrants | Russia | 90.1 /100 | #120 | Exceptional 83.2% |
| Uruguayans | 89.4 /100 | #121 | Excellent 83.1% |
| Immigrants | Vietnam | 88.9 /100 | #122 | Excellent 83.1% |
| Tongans | 88.2 /100 | #123 | Excellent 83.1% |
| Bermudans | 88.0 /100 | #124 | Excellent 83.1% |
| Immigrants | Iran | 87.2 /100 | #125 | Excellent 83.1% |
| Immigrants | Belgium | 86.4 /100 | #126 | Excellent 83.1% |
| Immigrants | Jordan | 85.2 /100 | #127 | Excellent 83.1% |
| Germans | 85.1 /100 | #128 | Excellent 83.1% |
| Immigrants | Northern Europe | 85.1 /100 | #129 | Excellent 83.1% |
| Immigrants | Israel | 84.7 /100 | #130 | Excellent 83.1% |
| Finns | 83.3 /100 | #131 | Excellent 83.1% |
Demographics Similar to Dutch by In Labor Force | Age 45-54
In terms of in labor force | age 45-54, the demographic groups most similar to Dutch are South American Indian (82.9%, a difference of 0.0%), Haitian (82.8%, a difference of 0.0%), German Russian (82.8%, a difference of 0.0%), Laotian (82.9%, a difference of 0.010%), and Immigrants from Sudan (82.8%, a difference of 0.020%).
| Demographics | Rating | Rank | In Labor Force | Age 45-54 |
| Immigrants | Saudi Arabia | 68.8 /100 | #156 | Good 82.9% |
| Immigrants | Australia | 68.2 /100 | #157 | Good 82.9% |
| Immigrants | Southern Europe | 67.8 /100 | #158 | Good 82.9% |
| Immigrants | Austria | 64.6 /100 | #159 | Good 82.9% |
| Laotians | 62.8 /100 | #160 | Good 82.9% |
| South American Indians | 62.2 /100 | #161 | Good 82.9% |
| Haitians | 61.8 /100 | #162 | Good 82.8% |
| Dutch | 61.7 /100 | #163 | Good 82.8% |
| German Russians | 61.3 /100 | #164 | Good 82.8% |
| Immigrants | Sudan | 59.9 /100 | #165 | Average 82.8% |
| Immigrants | South Eastern Asia | 57.4 /100 | #166 | Average 82.8% |
| Swiss | 56.5 /100 | #167 | Average 82.8% |
| Immigrants | South Africa | 55.8 /100 | #168 | Average 82.8% |
| Immigrants | Western Africa | 54.1 /100 | #169 | Average 82.8% |
| Pakistanis | 53.2 /100 | #170 | Average 82.8% |