Icelander vs Israeli In Labor Force | Age 45-54
COMPARE
Icelander
Israeli
In Labor Force | Age 45-54
In Labor Force | Age 45-54 Comparison
Icelanders
Israelis
82.8%
IN LABOR FORCE | AGE 45-54
51.8/ 100
METRIC RATING
172nd/ 347
METRIC RANK
82.7%
IN LABOR FORCE | AGE 45-54
37.7/ 100
METRIC RATING
181st/ 347
METRIC RANK
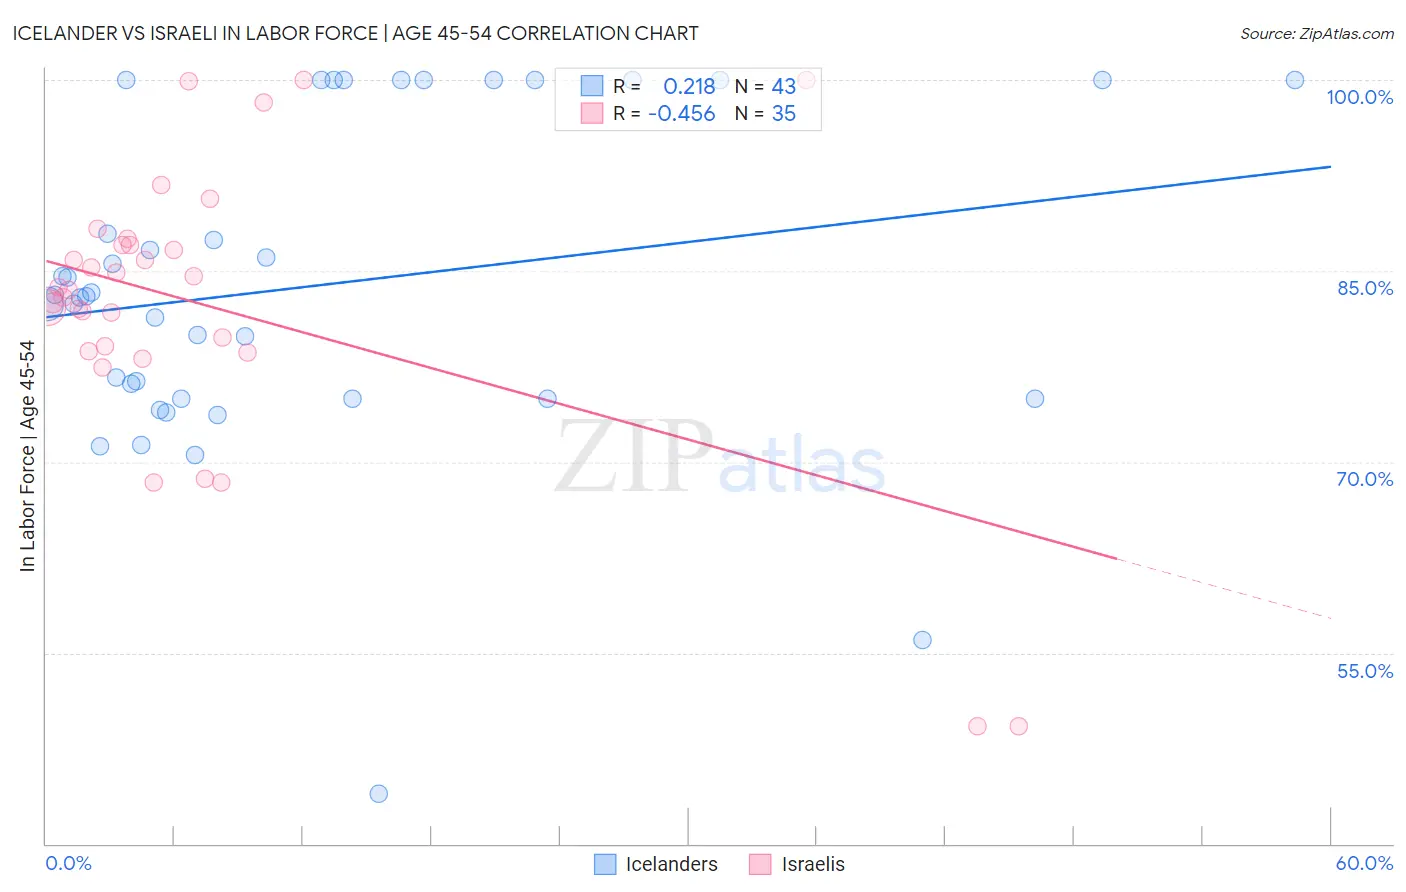
Icelander vs Israeli In Labor Force | Age 45-54 Correlation Chart
The statistical analysis conducted on geographies consisting of 159,615,670 people shows a weak positive correlation between the proportion of Icelanders and labor force participation rate among population between the ages 45 and 54 in the United States with a correlation coefficient (R) of 0.218 and weighted average of 82.8%. Similarly, the statistical analysis conducted on geographies consisting of 211,012,098 people shows a moderate negative correlation between the proportion of Israelis and labor force participation rate among population between the ages 45 and 54 in the United States with a correlation coefficient (R) of -0.456 and weighted average of 82.7%, a difference of 0.13%.
In Labor Force | Age 45-54 Correlation Summary
| Measurement | Icelander | Israeli |
| Minimum | 43.9% | 49.2% |
| Maximum | 100.0% | 100.0% |
| Range | 56.1% | 50.8% |
| Mean | 83.8% | 82.3% |
| Median | 83.0% | 83.5% |
| Interquartile 25% (IQ1) | 75.0% | 78.7% |
| Interquartile 75% (IQ3) | 100.0% | 87.0% |
| Interquartile Range (IQR) | 25.0% | 8.3% |
| Standard Deviation (Sample) | 12.8% | 11.3% |
| Standard Deviation (Population) | 12.6% | 11.2% |
Demographics Similar to Icelanders and Israelis by In Labor Force | Age 45-54
In terms of in labor force | age 45-54, the demographic groups most similar to Icelanders are Pakistani (82.8%, a difference of 0.010%), Immigrants from Zaire (82.8%, a difference of 0.010%), Nicaraguan (82.8%, a difference of 0.010%), Immigrants from Western Africa (82.8%, a difference of 0.020%), and Costa Rican (82.8%, a difference of 0.020%). Similarly, the demographic groups most similar to Israelis are Hungarian (82.7%, a difference of 0.0%), Immigrants from Hungary (82.7%, a difference of 0.010%), Immigrants from Switzerland (82.7%, a difference of 0.020%), Nigerian (82.7%, a difference of 0.030%), and New Zealander (82.6%, a difference of 0.050%).
| Demographics | Rating | Rank | In Labor Force | Age 45-54 |
| Immigrants | South Eastern Asia | 57.4 /100 | #166 | Average 82.8% |
| Swiss | 56.5 /100 | #167 | Average 82.8% |
| Immigrants | South Africa | 55.8 /100 | #168 | Average 82.8% |
| Immigrants | Western Africa | 54.1 /100 | #169 | Average 82.8% |
| Pakistanis | 53.2 /100 | #170 | Average 82.8% |
| Immigrants | Zaire | 52.9 /100 | #171 | Average 82.8% |
| Icelanders | 51.8 /100 | #172 | Average 82.8% |
| Nicaraguans | 50.3 /100 | #173 | Average 82.8% |
| Costa Ricans | 50.0 /100 | #174 | Average 82.8% |
| Immigrants | Liberia | 47.9 /100 | #175 | Average 82.7% |
| Northern Europeans | 46.9 /100 | #176 | Average 82.7% |
| Immigrants | Nicaragua | 44.6 /100 | #177 | Average 82.7% |
| Nigerians | 40.5 /100 | #178 | Average 82.7% |
| Immigrants | Switzerland | 39.4 /100 | #179 | Fair 82.7% |
| Hungarians | 38.0 /100 | #180 | Fair 82.7% |
| Israelis | 37.7 /100 | #181 | Fair 82.7% |
| Immigrants | Hungary | 37.1 /100 | #182 | Fair 82.7% |
| New Zealanders | 32.7 /100 | #183 | Fair 82.6% |
| Europeans | 32.6 /100 | #184 | Fair 82.6% |
| Immigrants | England | 32.2 /100 | #185 | Fair 82.6% |
| Irish | 29.2 /100 | #186 | Fair 82.6% |