Houma vs Immigrants from Iran In Labor Force | Age > 16
COMPARE
Houma
Immigrants from Iran
In Labor Force | Age > 16
In Labor Force | Age > 16 Comparison
Houma
Immigrants from Iran
59.5%
IN LABOR FORCE | AGE > 16
0.0/ 100
METRIC RATING
339th/ 347
METRIC RANK
65.7%
IN LABOR FORCE | AGE > 16
96.6/ 100
METRIC RATING
117th/ 347
METRIC RANK
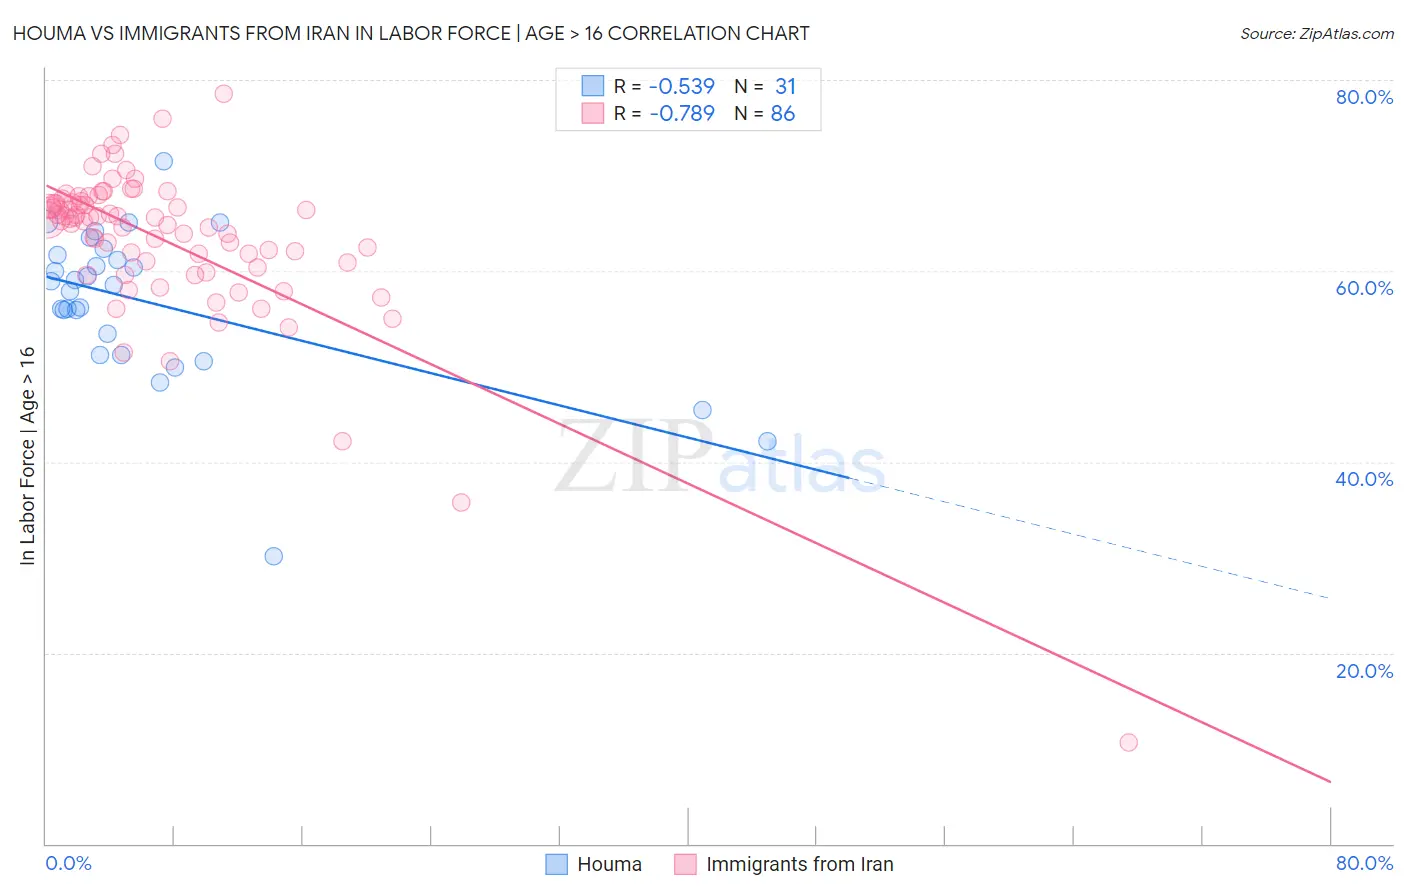
Houma vs Immigrants from Iran In Labor Force | Age > 16 Correlation Chart
The statistical analysis conducted on geographies consisting of 36,799,095 people shows a substantial negative correlation between the proportion of Houma and labor force participation rate among population ages 16 and over in the United States with a correlation coefficient (R) of -0.539 and weighted average of 59.5%. Similarly, the statistical analysis conducted on geographies consisting of 279,902,414 people shows a strong negative correlation between the proportion of Immigrants from Iran and labor force participation rate among population ages 16 and over in the United States with a correlation coefficient (R) of -0.789 and weighted average of 65.7%, a difference of 10.5%.
In Labor Force | Age > 16 Correlation Summary
| Measurement | Houma | Immigrants from Iran |
| Minimum | 30.1% | 10.6% |
| Maximum | 71.5% | 78.5% |
| Range | 41.4% | 67.9% |
| Mean | 56.7% | 63.2% |
| Median | 58.5% | 65.4% |
| Interquartile 25% (IQ1) | 51.2% | 60.9% |
| Interquartile 75% (IQ3) | 61.6% | 67.2% |
| Interquartile Range (IQR) | 10.4% | 6.3% |
| Standard Deviation (Sample) | 8.1% | 8.6% |
| Standard Deviation (Population) | 7.9% | 8.6% |
Similar Demographics by In Labor Force | Age > 16
Demographics Similar to Houma by In Labor Force | Age > 16
In terms of in labor force | age > 16, the demographic groups most similar to Houma are Immigrants from Yemen (59.6%, a difference of 0.25%), Pueblo (59.3%, a difference of 0.39%), Colville (59.8%, a difference of 0.52%), Menominee (60.6%, a difference of 1.8%), and Native/Alaskan (60.6%, a difference of 1.8%).
| Demographics | Rating | Rank | In Labor Force | Age > 16 |
| Crow | 0.0 /100 | #332 | Tragic 60.8% |
| Paiute | 0.0 /100 | #333 | Tragic 60.7% |
| Apache | 0.0 /100 | #334 | Tragic 60.7% |
| Natives/Alaskans | 0.0 /100 | #335 | Tragic 60.6% |
| Menominee | 0.0 /100 | #336 | Tragic 60.6% |
| Colville | 0.0 /100 | #337 | Tragic 59.8% |
| Immigrants | Yemen | 0.0 /100 | #338 | Tragic 59.6% |
| Houma | 0.0 /100 | #339 | Tragic 59.5% |
| Pueblo | 0.0 /100 | #340 | Tragic 59.3% |
| Hopi | 0.0 /100 | #341 | Tragic 58.4% |
| Puerto Ricans | 0.0 /100 | #342 | Tragic 58.1% |
| Yuman | 0.0 /100 | #343 | Tragic 57.8% |
| Pima | 0.0 /100 | #344 | Tragic 57.4% |
| Tohono O'odham | 0.0 /100 | #345 | Tragic 57.2% |
| Lumbee | 0.0 /100 | #346 | Tragic 56.8% |
Demographics Similar to Immigrants from Iran by In Labor Force | Age > 16
In terms of in labor force | age > 16, the demographic groups most similar to Immigrants from Iran are Immigrants from Thailand (65.7%, a difference of 0.0%), Immigrants from Indonesia (65.7%, a difference of 0.010%), Argentinean (65.7%, a difference of 0.010%), Immigrants from France (65.7%, a difference of 0.010%), and Immigrants from Hong Kong (65.7%, a difference of 0.030%).
| Demographics | Rating | Rank | In Labor Force | Age > 16 |
| Japanese | 97.7 /100 | #110 | Exceptional 65.8% |
| Immigrants | Honduras | 97.5 /100 | #111 | Exceptional 65.8% |
| Laotians | 97.4 /100 | #112 | Exceptional 65.8% |
| Pakistanis | 97.1 /100 | #113 | Exceptional 65.8% |
| Hondurans | 97.1 /100 | #114 | Exceptional 65.8% |
| Immigrants | Indonesia | 96.8 /100 | #115 | Exceptional 65.7% |
| Argentineans | 96.7 /100 | #116 | Exceptional 65.7% |
| Immigrants | Iran | 96.6 /100 | #117 | Exceptional 65.7% |
| Immigrants | Thailand | 96.6 /100 | #118 | Exceptional 65.7% |
| Immigrants | France | 96.4 /100 | #119 | Exceptional 65.7% |
| Immigrants | Hong Kong | 96.2 /100 | #120 | Exceptional 65.7% |
| New Zealanders | 96.0 /100 | #121 | Exceptional 65.7% |
| Immigrants | Ecuador | 95.9 /100 | #122 | Exceptional 65.7% |
| Immigrants | Iraq | 95.5 /100 | #123 | Exceptional 65.7% |
| Iraqis | 95.4 /100 | #124 | Exceptional 65.7% |