Houma vs Immigrants from Uzbekistan In Labor Force | Age > 16
COMPARE
Houma
Immigrants from Uzbekistan
In Labor Force | Age > 16
In Labor Force | Age > 16 Comparison
Houma
Immigrants from Uzbekistan
59.5%
IN LABOR FORCE | AGE > 16
0.0/ 100
METRIC RATING
339th/ 347
METRIC RANK
64.3%
IN LABOR FORCE | AGE > 16
1.4/ 100
METRIC RATING
254th/ 347
METRIC RANK
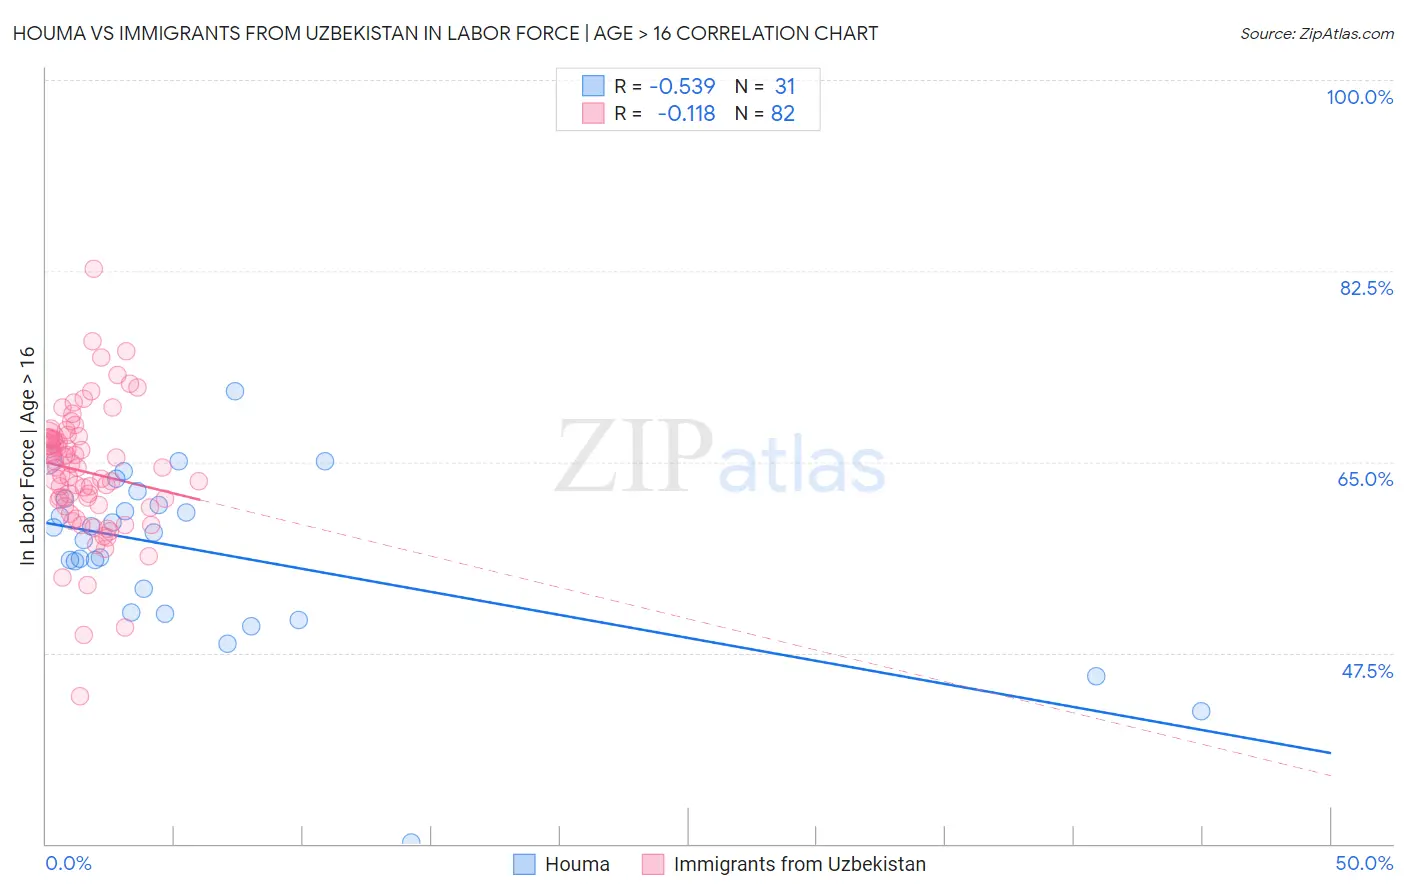
Houma vs Immigrants from Uzbekistan In Labor Force | Age > 16 Correlation Chart
The statistical analysis conducted on geographies consisting of 36,799,095 people shows a substantial negative correlation between the proportion of Houma and labor force participation rate among population ages 16 and over in the United States with a correlation coefficient (R) of -0.539 and weighted average of 59.5%. Similarly, the statistical analysis conducted on geographies consisting of 118,764,093 people shows a poor negative correlation between the proportion of Immigrants from Uzbekistan and labor force participation rate among population ages 16 and over in the United States with a correlation coefficient (R) of -0.118 and weighted average of 64.3%, a difference of 8.2%.
In Labor Force | Age > 16 Correlation Summary
| Measurement | Houma | Immigrants from Uzbekistan |
| Minimum | 30.1% | 43.5% |
| Maximum | 71.5% | 82.7% |
| Range | 41.4% | 39.2% |
| Mean | 56.7% | 64.1% |
| Median | 58.5% | 64.5% |
| Interquartile 25% (IQ1) | 51.2% | 60.9% |
| Interquartile 75% (IQ3) | 61.6% | 67.1% |
| Interquartile Range (IQR) | 10.4% | 6.2% |
| Standard Deviation (Sample) | 8.1% | 6.0% |
| Standard Deviation (Population) | 7.9% | 6.0% |
Similar Demographics by In Labor Force | Age > 16
Demographics Similar to Houma by In Labor Force | Age > 16
In terms of in labor force | age > 16, the demographic groups most similar to Houma are Immigrants from Yemen (59.6%, a difference of 0.25%), Pueblo (59.3%, a difference of 0.39%), Colville (59.8%, a difference of 0.52%), Menominee (60.6%, a difference of 1.8%), and Native/Alaskan (60.6%, a difference of 1.8%).
| Demographics | Rating | Rank | In Labor Force | Age > 16 |
| Crow | 0.0 /100 | #332 | Tragic 60.8% |
| Paiute | 0.0 /100 | #333 | Tragic 60.7% |
| Apache | 0.0 /100 | #334 | Tragic 60.7% |
| Natives/Alaskans | 0.0 /100 | #335 | Tragic 60.6% |
| Menominee | 0.0 /100 | #336 | Tragic 60.6% |
| Colville | 0.0 /100 | #337 | Tragic 59.8% |
| Immigrants | Yemen | 0.0 /100 | #338 | Tragic 59.6% |
| Houma | 0.0 /100 | #339 | Tragic 59.5% |
| Pueblo | 0.0 /100 | #340 | Tragic 59.3% |
| Hopi | 0.0 /100 | #341 | Tragic 58.4% |
| Puerto Ricans | 0.0 /100 | #342 | Tragic 58.1% |
| Yuman | 0.0 /100 | #343 | Tragic 57.8% |
| Pima | 0.0 /100 | #344 | Tragic 57.4% |
| Tohono O'odham | 0.0 /100 | #345 | Tragic 57.2% |
| Lumbee | 0.0 /100 | #346 | Tragic 56.8% |
Demographics Similar to Immigrants from Uzbekistan by In Labor Force | Age > 16
In terms of in labor force | age > 16, the demographic groups most similar to Immigrants from Uzbekistan are Czechoslovakian (64.3%, a difference of 0.0%), Immigrants from Dominican Republic (64.4%, a difference of 0.010%), Portuguese (64.4%, a difference of 0.040%), British West Indian (64.4%, a difference of 0.060%), and German (64.4%, a difference of 0.070%).
| Demographics | Rating | Rank | In Labor Force | Age > 16 |
| Swiss | 2.1 /100 | #247 | Tragic 64.4% |
| Immigrants | Barbados | 2.1 /100 | #248 | Tragic 64.4% |
| Germans | 1.8 /100 | #249 | Tragic 64.4% |
| British West Indians | 1.8 /100 | #250 | Tragic 64.4% |
| Portuguese | 1.6 /100 | #251 | Tragic 64.4% |
| Immigrants | Dominican Republic | 1.5 /100 | #252 | Tragic 64.4% |
| Czechoslovakians | 1.4 /100 | #253 | Tragic 64.3% |
| Immigrants | Uzbekistan | 1.4 /100 | #254 | Tragic 64.3% |
| Hispanics or Latinos | 1.1 /100 | #255 | Tragic 64.3% |
| Immigrants | Mexico | 1.0 /100 | #256 | Tragic 64.3% |
| Inupiat | 0.8 /100 | #257 | Tragic 64.3% |
| Immigrants | Scotland | 0.8 /100 | #258 | Tragic 64.2% |
| Immigrants | Western Europe | 0.7 /100 | #259 | Tragic 64.2% |
| Marshallese | 0.7 /100 | #260 | Tragic 64.2% |
| Basques | 0.7 /100 | #261 | Tragic 64.2% |