Immigrants from Fiji vs Immigrants from Iran In Labor Force | Age > 16
COMPARE
Immigrants from Fiji
Immigrants from Iran
In Labor Force | Age > 16
In Labor Force | Age > 16 Comparison
Immigrants from Fiji
Immigrants from Iran
65.0%
IN LABOR FORCE | AGE > 16
33.7/ 100
METRIC RATING
192nd/ 347
METRIC RANK
65.7%
IN LABOR FORCE | AGE > 16
96.6/ 100
METRIC RATING
117th/ 347
METRIC RANK
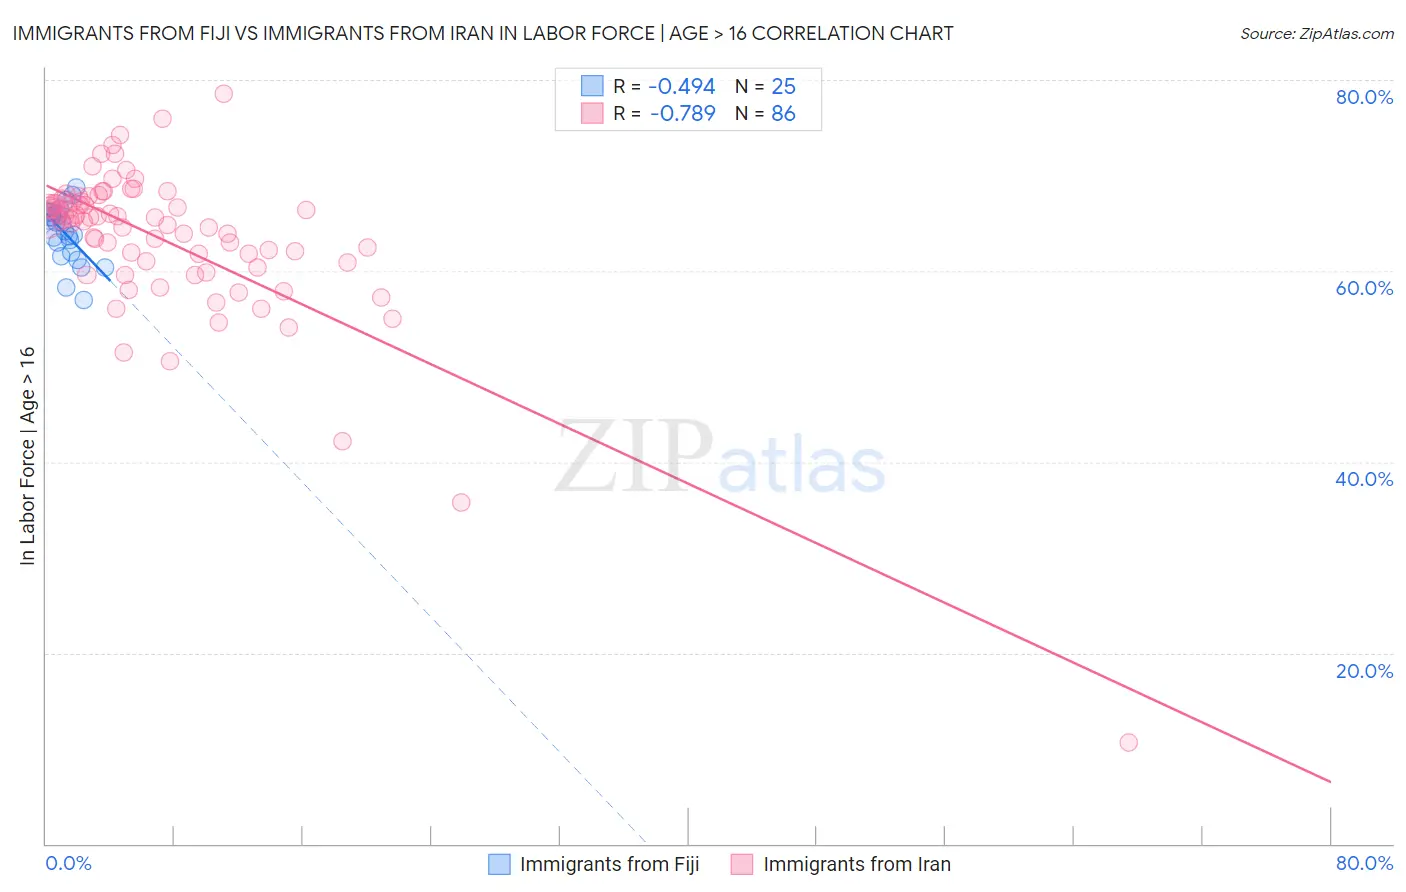
Immigrants from Fiji vs Immigrants from Iran In Labor Force | Age > 16 Correlation Chart
The statistical analysis conducted on geographies consisting of 93,756,016 people shows a moderate negative correlation between the proportion of Immigrants from Fiji and labor force participation rate among population ages 16 and over in the United States with a correlation coefficient (R) of -0.494 and weighted average of 65.0%. Similarly, the statistical analysis conducted on geographies consisting of 279,902,414 people shows a strong negative correlation between the proportion of Immigrants from Iran and labor force participation rate among population ages 16 and over in the United States with a correlation coefficient (R) of -0.789 and weighted average of 65.7%, a difference of 1.1%.
In Labor Force | Age > 16 Correlation Summary
| Measurement | Immigrants from Fiji | Immigrants from Iran |
| Minimum | 57.0% | 10.6% |
| Maximum | 68.8% | 78.5% |
| Range | 11.8% | 67.9% |
| Mean | 63.9% | 63.2% |
| Median | 64.2% | 65.4% |
| Interquartile 25% (IQ1) | 61.7% | 60.9% |
| Interquartile 75% (IQ3) | 66.0% | 67.2% |
| Interquartile Range (IQR) | 4.3% | 6.3% |
| Standard Deviation (Sample) | 3.0% | 8.6% |
| Standard Deviation (Population) | 2.9% | 8.6% |
Similar Demographics by In Labor Force | Age > 16
Demographics Similar to Immigrants from Fiji by In Labor Force | Age > 16
In terms of in labor force | age > 16, the demographic groups most similar to Immigrants from Fiji are Barbadian (65.0%, a difference of 0.0%), Scandinavian (65.0%, a difference of 0.0%), Immigrants from Europe (65.0%, a difference of 0.0%), Immigrants from Portugal (65.0%, a difference of 0.010%), and Immigrants from Greece (65.0%, a difference of 0.010%).
| Demographics | Rating | Rank | In Labor Force | Age > 16 |
| Syrians | 40.0 /100 | #185 | Average 65.0% |
| Immigrants | Switzerland | 38.2 /100 | #186 | Fair 65.0% |
| Immigrants | Croatia | 35.7 /100 | #187 | Fair 65.0% |
| Immigrants | Portugal | 34.8 /100 | #188 | Fair 65.0% |
| Immigrants | Greece | 34.3 /100 | #189 | Fair 65.0% |
| Barbadians | 33.9 /100 | #190 | Fair 65.0% |
| Scandinavians | 33.7 /100 | #191 | Fair 65.0% |
| Immigrants | Fiji | 33.7 /100 | #192 | Fair 65.0% |
| Immigrants | Europe | 33.6 /100 | #193 | Fair 65.0% |
| Immigrants | Southern Europe | 31.3 /100 | #194 | Fair 65.0% |
| Romanians | 31.1 /100 | #195 | Fair 65.0% |
| Haitians | 30.6 /100 | #196 | Fair 65.0% |
| Immigrants | Italy | 28.7 /100 | #197 | Fair 65.0% |
| Greeks | 26.1 /100 | #198 | Fair 64.9% |
| Mexican American Indians | 23.1 /100 | #199 | Fair 64.9% |
Demographics Similar to Immigrants from Iran by In Labor Force | Age > 16
In terms of in labor force | age > 16, the demographic groups most similar to Immigrants from Iran are Immigrants from Thailand (65.7%, a difference of 0.0%), Immigrants from Indonesia (65.7%, a difference of 0.010%), Argentinean (65.7%, a difference of 0.010%), Immigrants from France (65.7%, a difference of 0.010%), and Immigrants from Hong Kong (65.7%, a difference of 0.030%).
| Demographics | Rating | Rank | In Labor Force | Age > 16 |
| Japanese | 97.7 /100 | #110 | Exceptional 65.8% |
| Immigrants | Honduras | 97.5 /100 | #111 | Exceptional 65.8% |
| Laotians | 97.4 /100 | #112 | Exceptional 65.8% |
| Pakistanis | 97.1 /100 | #113 | Exceptional 65.8% |
| Hondurans | 97.1 /100 | #114 | Exceptional 65.8% |
| Immigrants | Indonesia | 96.8 /100 | #115 | Exceptional 65.7% |
| Argentineans | 96.7 /100 | #116 | Exceptional 65.7% |
| Immigrants | Iran | 96.6 /100 | #117 | Exceptional 65.7% |
| Immigrants | Thailand | 96.6 /100 | #118 | Exceptional 65.7% |
| Immigrants | France | 96.4 /100 | #119 | Exceptional 65.7% |
| Immigrants | Hong Kong | 96.2 /100 | #120 | Exceptional 65.7% |
| New Zealanders | 96.0 /100 | #121 | Exceptional 65.7% |
| Immigrants | Ecuador | 95.9 /100 | #122 | Exceptional 65.7% |
| Immigrants | Iraq | 95.5 /100 | #123 | Exceptional 65.7% |
| Iraqis | 95.4 /100 | #124 | Exceptional 65.7% |