Houma vs Canadian In Labor Force | Age > 16
COMPARE
Houma
Canadian
In Labor Force | Age > 16
In Labor Force | Age > 16 Comparison
Houma
Canadians
59.5%
IN LABOR FORCE | AGE > 16
0.0/ 100
METRIC RATING
339th/ 347
METRIC RANK
64.1%
IN LABOR FORCE | AGE > 16
0.5/ 100
METRIC RATING
267th/ 347
METRIC RANK
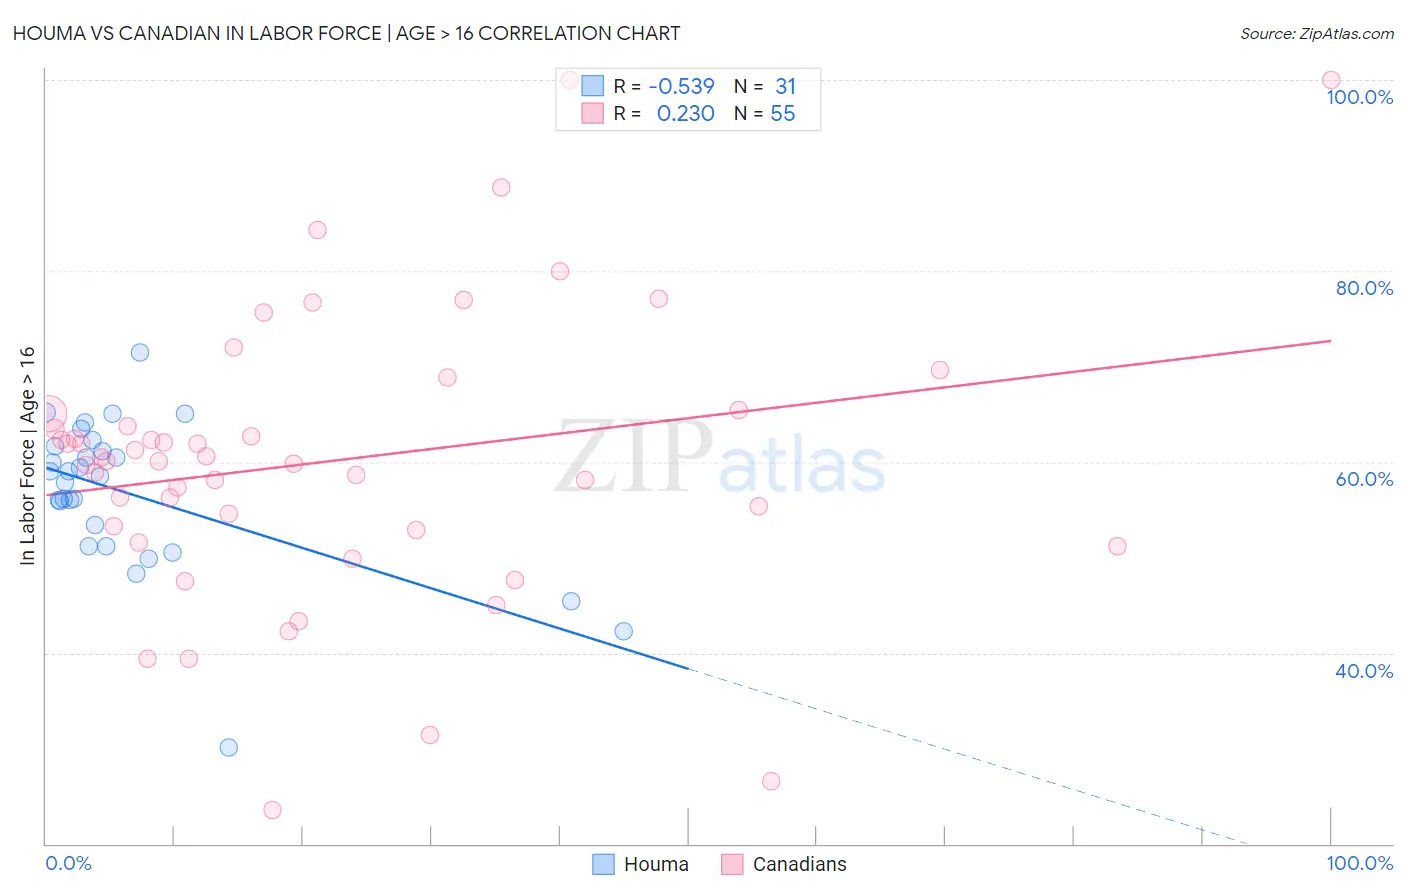
Houma vs Canadian In Labor Force | Age > 16 Correlation Chart
The statistical analysis conducted on geographies consisting of 36,799,095 people shows a substantial negative correlation between the proportion of Houma and labor force participation rate among population ages 16 and over in the United States with a correlation coefficient (R) of -0.539 and weighted average of 59.5%. Similarly, the statistical analysis conducted on geographies consisting of 437,567,270 people shows a weak positive correlation between the proportion of Canadians and labor force participation rate among population ages 16 and over in the United States with a correlation coefficient (R) of 0.230 and weighted average of 64.1%, a difference of 7.8%.
In Labor Force | Age > 16 Correlation Summary
| Measurement | Houma | Canadian |
| Minimum | 30.1% | 23.5% |
| Maximum | 71.5% | 100.0% |
| Range | 41.4% | 76.5% |
| Mean | 56.7% | 60.1% |
| Median | 58.5% | 60.1% |
| Interquartile 25% (IQ1) | 51.2% | 52.8% |
| Interquartile 75% (IQ3) | 61.6% | 65.0% |
| Interquartile Range (IQR) | 10.4% | 12.2% |
| Standard Deviation (Sample) | 8.1% | 15.1% |
| Standard Deviation (Population) | 7.9% | 14.9% |
Similar Demographics by In Labor Force | Age > 16
Demographics Similar to Houma by In Labor Force | Age > 16
In terms of in labor force | age > 16, the demographic groups most similar to Houma are Immigrants from Yemen (59.6%, a difference of 0.25%), Pueblo (59.3%, a difference of 0.39%), Colville (59.8%, a difference of 0.52%), Menominee (60.6%, a difference of 1.8%), and Native/Alaskan (60.6%, a difference of 1.8%).
| Demographics | Rating | Rank | In Labor Force | Age > 16 |
| Crow | 0.0 /100 | #332 | Tragic 60.8% |
| Paiute | 0.0 /100 | #333 | Tragic 60.7% |
| Apache | 0.0 /100 | #334 | Tragic 60.7% |
| Natives/Alaskans | 0.0 /100 | #335 | Tragic 60.6% |
| Menominee | 0.0 /100 | #336 | Tragic 60.6% |
| Colville | 0.0 /100 | #337 | Tragic 59.8% |
| Immigrants | Yemen | 0.0 /100 | #338 | Tragic 59.6% |
| Houma | 0.0 /100 | #339 | Tragic 59.5% |
| Pueblo | 0.0 /100 | #340 | Tragic 59.3% |
| Hopi | 0.0 /100 | #341 | Tragic 58.4% |
| Puerto Ricans | 0.0 /100 | #342 | Tragic 58.1% |
| Yuman | 0.0 /100 | #343 | Tragic 57.8% |
| Pima | 0.0 /100 | #344 | Tragic 57.4% |
| Tohono O'odham | 0.0 /100 | #345 | Tragic 57.2% |
| Lumbee | 0.0 /100 | #346 | Tragic 56.8% |
Demographics Similar to Canadians by In Labor Force | Age > 16
In terms of in labor force | age > 16, the demographic groups most similar to Canadians are Spaniard (64.1%, a difference of 0.0%), Immigrants from England (64.2%, a difference of 0.010%), Cuban (64.2%, a difference of 0.020%), Irish (64.1%, a difference of 0.040%), and Dutch (64.2%, a difference of 0.060%).
| Demographics | Rating | Rank | In Labor Force | Age > 16 |
| Marshallese | 0.7 /100 | #260 | Tragic 64.2% |
| Basques | 0.7 /100 | #261 | Tragic 64.2% |
| Finns | 0.7 /100 | #262 | Tragic 64.2% |
| Bahamians | 0.6 /100 | #263 | Tragic 64.2% |
| Dutch | 0.6 /100 | #264 | Tragic 64.2% |
| Cubans | 0.5 /100 | #265 | Tragic 64.2% |
| Immigrants | England | 0.5 /100 | #266 | Tragic 64.2% |
| Canadians | 0.5 /100 | #267 | Tragic 64.1% |
| Spaniards | 0.5 /100 | #268 | Tragic 64.1% |
| Irish | 0.4 /100 | #269 | Tragic 64.1% |
| Guyanese | 0.4 /100 | #270 | Tragic 64.1% |
| Dominicans | 0.4 /100 | #271 | Tragic 64.1% |
| Native Hawaiians | 0.3 /100 | #272 | Tragic 64.1% |
| Hmong | 0.3 /100 | #273 | Tragic 64.1% |
| Immigrants | Cuba | 0.3 /100 | #274 | Tragic 64.1% |