Houma vs Immigrants from Iran Kindergarten
COMPARE
Houma
Immigrants from Iran
Kindergarten
Kindergarten Comparison
Houma
Immigrants from Iran
97.3%
KINDERGARTEN
0.0/ 100
METRIC RATING
291st/ 347
METRIC RANK
98.0%
KINDERGARTEN
68.8/ 100
METRIC RATING
154th/ 347
METRIC RANK
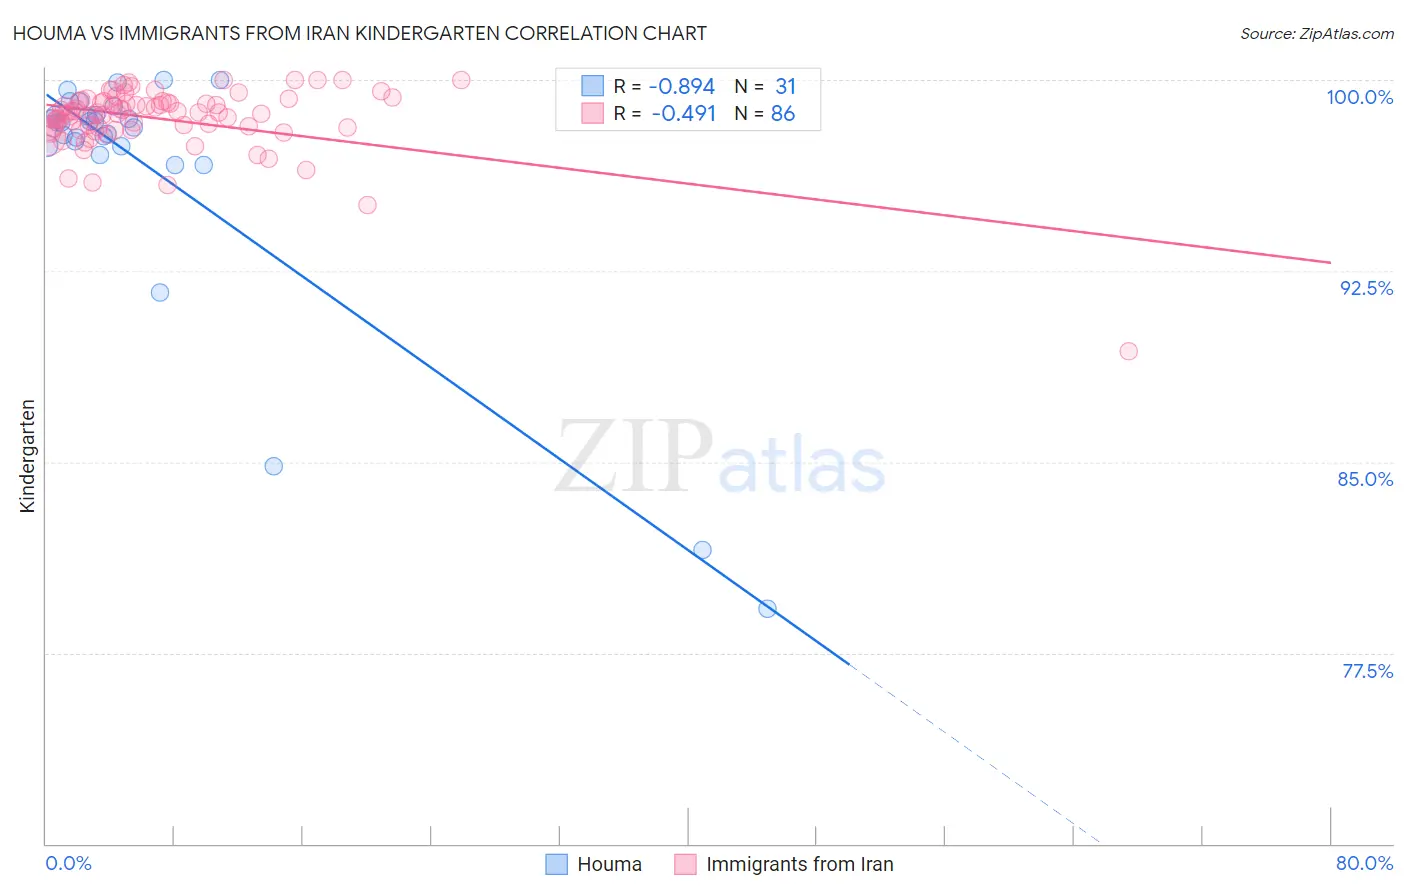
Houma vs Immigrants from Iran Kindergarten Correlation Chart
The statistical analysis conducted on geographies consisting of 36,795,916 people shows a very strong negative correlation between the proportion of Houma and percentage of population with at least kindergarten education in the United States with a correlation coefficient (R) of -0.894 and weighted average of 97.3%. Similarly, the statistical analysis conducted on geographies consisting of 279,886,762 people shows a moderate negative correlation between the proportion of Immigrants from Iran and percentage of population with at least kindergarten education in the United States with a correlation coefficient (R) of -0.491 and weighted average of 98.0%, a difference of 0.77%.
Kindergarten Correlation Summary
| Measurement | Houma | Immigrants from Iran |
| Minimum | 79.2% | 89.4% |
| Maximum | 100.0% | 100.0% |
| Range | 20.8% | 10.6% |
| Mean | 96.5% | 98.5% |
| Median | 98.3% | 98.7% |
| Interquartile 25% (IQ1) | 97.4% | 98.1% |
| Interquartile 75% (IQ3) | 98.6% | 99.2% |
| Interquartile Range (IQR) | 1.2% | 1.0% |
| Standard Deviation (Sample) | 5.1% | 1.4% |
| Standard Deviation (Population) | 5.1% | 1.4% |
Similar Demographics by Kindergarten
Demographics Similar to Houma by Kindergarten
In terms of kindergarten, the demographic groups most similar to Houma are British West Indian (97.3%, a difference of 0.010%), Immigrants from St. Vincent and the Grenadines (97.3%, a difference of 0.020%), Immigrants from Afghanistan (97.3%, a difference of 0.030%), Malaysian (97.2%, a difference of 0.030%), and Immigrants from Thailand (97.3%, a difference of 0.050%).
| Demographics | Rating | Rank | Kindergarten |
| Immigrants | Trinidad and Tobago | 0.0 /100 | #284 | Tragic 97.3% |
| Immigrants | Portugal | 0.0 /100 | #285 | Tragic 97.3% |
| Immigrants | Barbados | 0.0 /100 | #286 | Tragic 97.3% |
| Immigrants | Hong Kong | 0.0 /100 | #287 | Tragic 97.3% |
| Immigrants | Thailand | 0.0 /100 | #288 | Tragic 97.3% |
| Immigrants | Afghanistan | 0.0 /100 | #289 | Tragic 97.3% |
| Immigrants | St. Vincent and the Grenadines | 0.0 /100 | #290 | Tragic 97.3% |
| Houma | 0.0 /100 | #291 | Tragic 97.3% |
| British West Indians | 0.0 /100 | #292 | Tragic 97.3% |
| Malaysians | 0.0 /100 | #293 | Tragic 97.2% |
| Immigrants | Immigrants | 0.0 /100 | #294 | Tragic 97.2% |
| Immigrants | Grenada | 0.0 /100 | #295 | Tragic 97.2% |
| Immigrants | Eritrea | 0.0 /100 | #296 | Tragic 97.2% |
| Central American Indians | 0.0 /100 | #297 | Tragic 97.2% |
| Immigrants | Dominica | 0.0 /100 | #298 | Tragic 97.1% |
Demographics Similar to Immigrants from Iran by Kindergarten
In terms of kindergarten, the demographic groups most similar to Immigrants from Iran are Dutch West Indian (98.0%, a difference of 0.0%), Immigrants from Moldova (98.0%, a difference of 0.0%), Comanche (98.0%, a difference of 0.0%), Soviet Union (98.0%, a difference of 0.010%), and Immigrants from South Central Asia (98.0%, a difference of 0.010%).
| Demographics | Rating | Rank | Kindergarten |
| Immigrants | Israel | 77.6 /100 | #147 | Good 98.0% |
| Apache | 75.0 /100 | #148 | Good 98.0% |
| Immigrants | Greece | 74.9 /100 | #149 | Good 98.0% |
| Jordanians | 72.8 /100 | #150 | Good 98.0% |
| Soviet Union | 70.8 /100 | #151 | Good 98.0% |
| Dutch West Indians | 70.1 /100 | #152 | Good 98.0% |
| Immigrants | Moldova | 69.1 /100 | #153 | Good 98.0% |
| Immigrants | Iran | 68.8 /100 | #154 | Good 98.0% |
| Comanche | 68.3 /100 | #155 | Good 98.0% |
| Immigrants | South Central Asia | 66.6 /100 | #156 | Good 98.0% |
| Immigrants | North Macedonia | 66.4 /100 | #157 | Good 98.0% |
| Venezuelans | 64.7 /100 | #158 | Good 98.0% |
| French American Indians | 63.7 /100 | #159 | Good 98.0% |
| Immigrants | Russia | 59.0 /100 | #160 | Average 98.0% |
| Immigrants | Eastern Europe | 59.0 /100 | #161 | Average 98.0% |