Houma vs Immigrants from Iran 6th Grade
COMPARE
Houma
Immigrants from Iran
6th Grade
6th Grade Comparison
Houma
Immigrants from Iran
96.2%
6TH GRADE
0.1/ 100
METRIC RATING
282nd/ 347
METRIC RANK
97.1%
6TH GRADE
63.3/ 100
METRIC RATING
158th/ 347
METRIC RANK
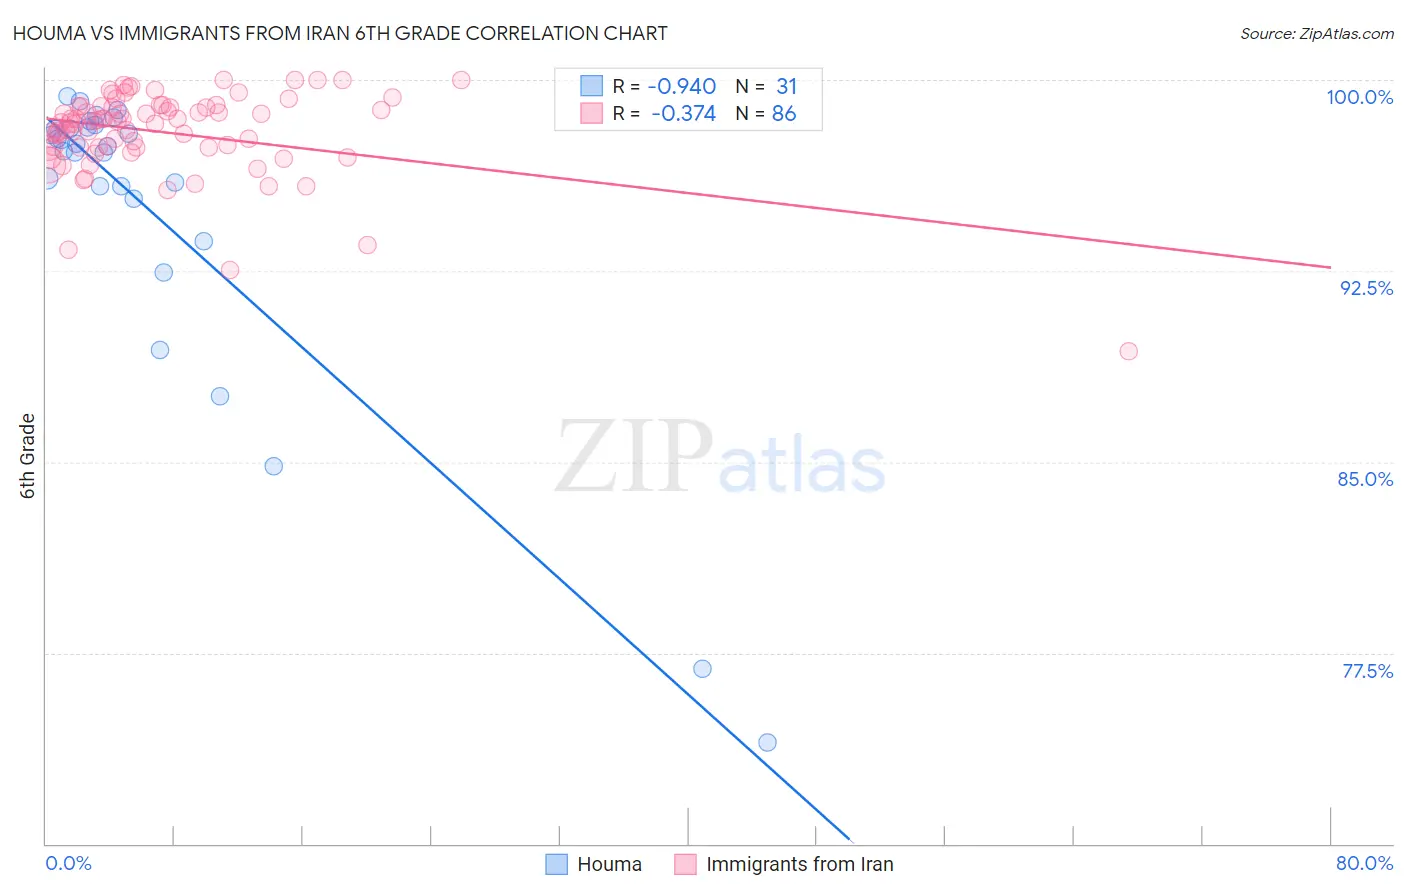
Houma vs Immigrants from Iran 6th Grade Correlation Chart
The statistical analysis conducted on geographies consisting of 36,795,916 people shows a near-perfect negative correlation between the proportion of Houma and percentage of population with at least 6th grade education in the United States with a correlation coefficient (R) of -0.940 and weighted average of 96.2%. Similarly, the statistical analysis conducted on geographies consisting of 279,867,553 people shows a mild negative correlation between the proportion of Immigrants from Iran and percentage of population with at least 6th grade education in the United States with a correlation coefficient (R) of -0.374 and weighted average of 97.1%, a difference of 0.90%.
6th Grade Correlation Summary
| Measurement | Houma | Immigrants from Iran |
| Minimum | 74.0% | 89.4% |
| Maximum | 99.4% | 100.0% |
| Range | 25.4% | 10.6% |
| Mean | 94.9% | 97.9% |
| Median | 97.4% | 98.3% |
| Interquartile 25% (IQ1) | 95.3% | 97.4% |
| Interquartile 75% (IQ3) | 98.1% | 99.0% |
| Interquartile Range (IQR) | 2.8% | 1.6% |
| Standard Deviation (Sample) | 6.2% | 1.7% |
| Standard Deviation (Population) | 6.1% | 1.7% |
Similar Demographics by 6th Grade
Demographics Similar to Houma by 6th Grade
In terms of 6th grade, the demographic groups most similar to Houma are Immigrants from Peru (96.2%, a difference of 0.0%), Immigrants from Afghanistan (96.2%, a difference of 0.0%), Trinidadian and Tobagonian (96.2%, a difference of 0.0%), Cuban (96.2%, a difference of 0.010%), and Immigrants from Western Africa (96.3%, a difference of 0.020%).
| Demographics | Rating | Rank | 6th Grade |
| Immigrants | Ghana | 0.1 /100 | #275 | Tragic 96.3% |
| Yaqui | 0.1 /100 | #276 | Tragic 96.3% |
| Immigrants | Western Africa | 0.1 /100 | #277 | Tragic 96.3% |
| Immigrants | Thailand | 0.1 /100 | #278 | Tragic 96.3% |
| Immigrants | Peru | 0.1 /100 | #279 | Tragic 96.2% |
| Immigrants | Afghanistan | 0.1 /100 | #280 | Tragic 96.2% |
| Trinidadians and Tobagonians | 0.1 /100 | #281 | Tragic 96.2% |
| Houma | 0.1 /100 | #282 | Tragic 96.2% |
| Cubans | 0.1 /100 | #283 | Tragic 96.2% |
| Fijians | 0.1 /100 | #284 | Tragic 96.2% |
| Somalis | 0.1 /100 | #285 | Tragic 96.2% |
| Barbadians | 0.0 /100 | #286 | Tragic 96.2% |
| Immigrants | Trinidad and Tobago | 0.0 /100 | #287 | Tragic 96.2% |
| Malaysians | 0.0 /100 | #288 | Tragic 96.2% |
| Immigrants | Eritrea | 0.0 /100 | #289 | Tragic 96.1% |
Demographics Similar to Immigrants from Iran by 6th Grade
In terms of 6th grade, the demographic groups most similar to Immigrants from Iran are Kenyan (97.1%, a difference of 0.0%), Ugandan (97.1%, a difference of 0.010%), Immigrants from Belarus (97.1%, a difference of 0.010%), Marshallese (97.1%, a difference of 0.010%), and Immigrants from Russia (97.1%, a difference of 0.020%).
| Demographics | Rating | Rank | 6th Grade |
| French American Indians | 74.0 /100 | #151 | Good 97.2% |
| Immigrants | Jordan | 73.0 /100 | #152 | Good 97.2% |
| Immigrants | Eastern Europe | 72.6 /100 | #153 | Good 97.2% |
| Soviet Union | 71.5 /100 | #154 | Good 97.2% |
| Ute | 71.1 /100 | #155 | Good 97.1% |
| Alsatians | 69.8 /100 | #156 | Good 97.1% |
| Immigrants | Russia | 67.6 /100 | #157 | Good 97.1% |
| Immigrants | Iran | 63.3 /100 | #158 | Good 97.1% |
| Kenyans | 62.9 /100 | #159 | Good 97.1% |
| Ugandans | 62.2 /100 | #160 | Good 97.1% |
| Immigrants | Belarus | 60.4 /100 | #161 | Good 97.1% |
| Marshallese | 60.2 /100 | #162 | Good 97.1% |
| Albanians | 57.8 /100 | #163 | Average 97.1% |
| Immigrants | Korea | 57.7 /100 | #164 | Average 97.1% |
| Immigrants | Poland | 56.2 /100 | #165 | Average 97.1% |