Honduran vs Swedish In Labor Force | Age 35-44
COMPARE
Honduran
Swedish
In Labor Force | Age 35-44
In Labor Force | Age 35-44 Comparison
Hondurans
Swedes
83.4%
IN LABOR FORCE | AGE 35-44
0.1/ 100
METRIC RATING
268th/ 347
METRIC RANK
85.0%
IN LABOR FORCE | AGE 35-44
99.2/ 100
METRIC RATING
64th/ 347
METRIC RANK
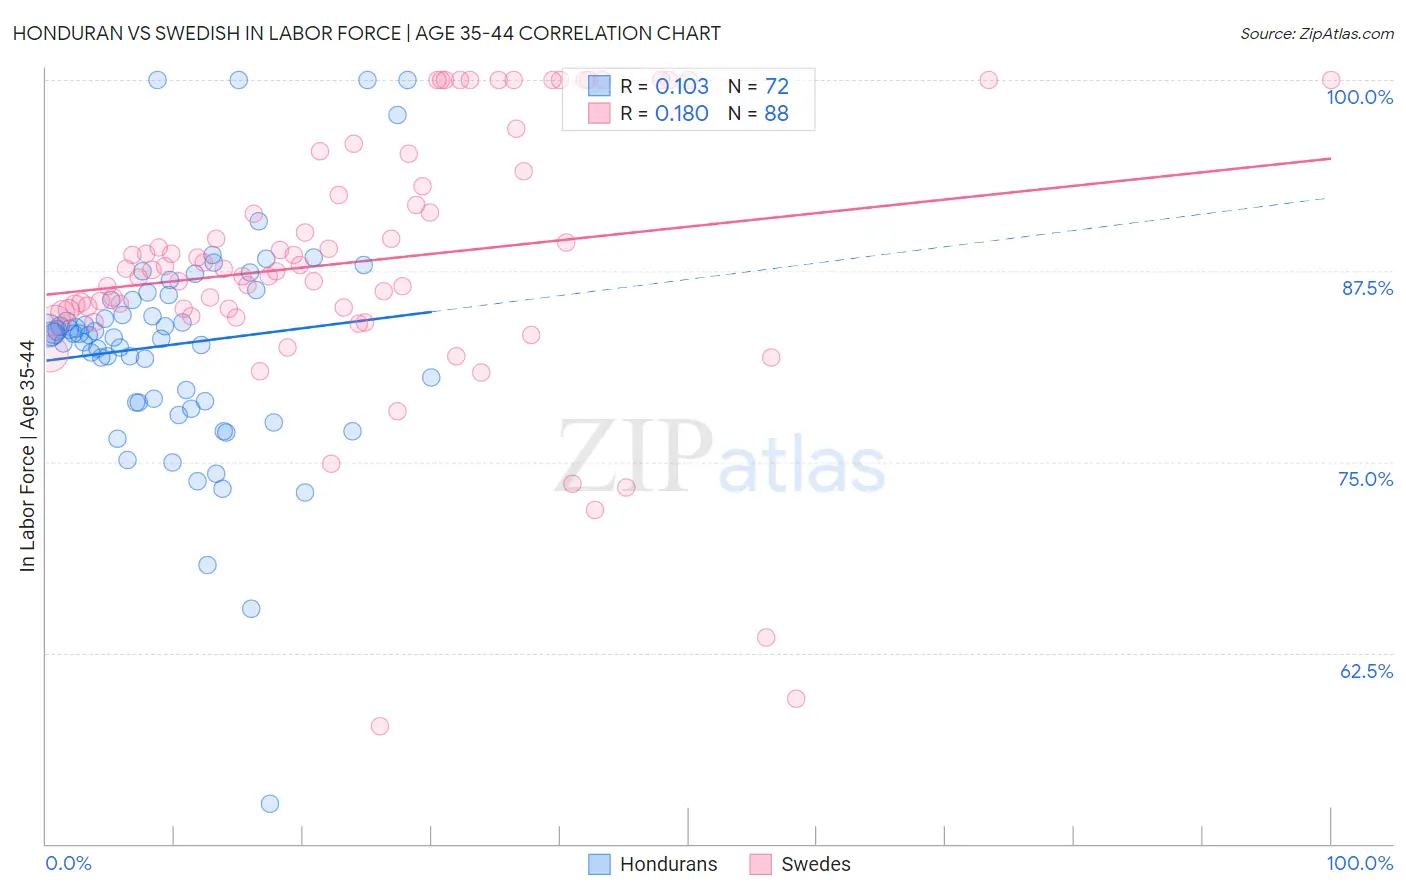
Honduran vs Swedish In Labor Force | Age 35-44 Correlation Chart
The statistical analysis conducted on geographies consisting of 357,674,403 people shows a poor positive correlation between the proportion of Hondurans and labor force participation rate among population between the ages 35 and 44 in the United States with a correlation coefficient (R) of 0.103 and weighted average of 83.4%. Similarly, the statistical analysis conducted on geographies consisting of 538,724,566 people shows a poor positive correlation between the proportion of Swedes and labor force participation rate among population between the ages 35 and 44 in the United States with a correlation coefficient (R) of 0.180 and weighted average of 85.0%, a difference of 2.0%.
In Labor Force | Age 35-44 Correlation Summary
| Measurement | Honduran | Swedish |
| Minimum | 52.6% | 57.7% |
| Maximum | 100.0% | 100.0% |
| Range | 47.4% | 42.3% |
| Mean | 82.7% | 88.1% |
| Median | 83.4% | 87.6% |
| Interquartile 25% (IQ1) | 79.0% | 84.9% |
| Interquartile 75% (IQ3) | 85.8% | 93.5% |
| Interquartile Range (IQR) | 6.8% | 8.6% |
| Standard Deviation (Sample) | 7.5% | 8.7% |
| Standard Deviation (Population) | 7.4% | 8.6% |
Similar Demographics by In Labor Force | Age 35-44
Demographics Similar to Hondurans by In Labor Force | Age 35-44
In terms of in labor force | age 35-44, the demographic groups most similar to Hondurans are Immigrants from Grenada (83.3%, a difference of 0.010%), Guamanian/Chamorro (83.4%, a difference of 0.030%), Spaniard (83.4%, a difference of 0.080%), Scotch-Irish (83.5%, a difference of 0.12%), and Central American (83.5%, a difference of 0.12%).
| Demographics | Rating | Rank | In Labor Force | Age 35-44 |
| Immigrants | Dominica | 0.2 /100 | #261 | Tragic 83.5% |
| Immigrants | Congo | 0.2 /100 | #262 | Tragic 83.5% |
| Iroquois | 0.2 /100 | #263 | Tragic 83.5% |
| Scotch-Irish | 0.1 /100 | #264 | Tragic 83.5% |
| Central Americans | 0.1 /100 | #265 | Tragic 83.5% |
| Spaniards | 0.1 /100 | #266 | Tragic 83.4% |
| Guamanians/Chamorros | 0.1 /100 | #267 | Tragic 83.4% |
| Hondurans | 0.1 /100 | #268 | Tragic 83.4% |
| Immigrants | Grenada | 0.1 /100 | #269 | Tragic 83.3% |
| Immigrants | Honduras | 0.0 /100 | #270 | Tragic 83.3% |
| French American Indians | 0.0 /100 | #271 | Tragic 83.2% |
| Immigrants | Fiji | 0.0 /100 | #272 | Tragic 83.2% |
| Spanish | 0.0 /100 | #273 | Tragic 83.2% |
| Immigrants | Nonimmigrants | 0.0 /100 | #274 | Tragic 83.2% |
| Hawaiians | 0.0 /100 | #275 | Tragic 83.2% |
Demographics Similar to Swedes by In Labor Force | Age 35-44
In terms of in labor force | age 35-44, the demographic groups most similar to Swedes are Immigrants from Moldova (85.0%, a difference of 0.010%), Immigrants from Uganda (85.0%, a difference of 0.010%), Immigrants from Brazil (85.0%, a difference of 0.010%), Immigrants from Latvia (85.0%, a difference of 0.020%), and Immigrants from Haiti (85.0%, a difference of 0.020%).
| Demographics | Rating | Rank | In Labor Force | Age 35-44 |
| Chinese | 99.4 /100 | #57 | Exceptional 85.1% |
| Slovaks | 99.4 /100 | #58 | Exceptional 85.1% |
| Serbians | 99.4 /100 | #59 | Exceptional 85.1% |
| Albanians | 99.4 /100 | #60 | Exceptional 85.1% |
| Immigrants | Latvia | 99.3 /100 | #61 | Exceptional 85.0% |
| Immigrants | Moldova | 99.3 /100 | #62 | Exceptional 85.0% |
| Immigrants | Uganda | 99.3 /100 | #63 | Exceptional 85.0% |
| Swedes | 99.2 /100 | #64 | Exceptional 85.0% |
| Immigrants | Brazil | 99.2 /100 | #65 | Exceptional 85.0% |
| Immigrants | Haiti | 99.1 /100 | #66 | Exceptional 85.0% |
| Immigrants | Italy | 99.1 /100 | #67 | Exceptional 85.0% |
| Italians | 99.1 /100 | #68 | Exceptional 85.0% |
| Sudanese | 99.0 /100 | #69 | Exceptional 85.0% |
| Brazilians | 99.0 /100 | #70 | Exceptional 85.0% |
| Russians | 99.0 /100 | #71 | Exceptional 85.0% |