Brazilian vs Thai In Labor Force | Age 35-44
COMPARE
Brazilian
Thai
In Labor Force | Age 35-44
In Labor Force | Age 35-44 Comparison
Brazilians
Thais
85.0%
IN LABOR FORCE | AGE 35-44
99.0/ 100
METRIC RATING
70th/ 347
METRIC RANK
85.2%
IN LABOR FORCE | AGE 35-44
99.7/ 100
METRIC RATING
50th/ 347
METRIC RANK
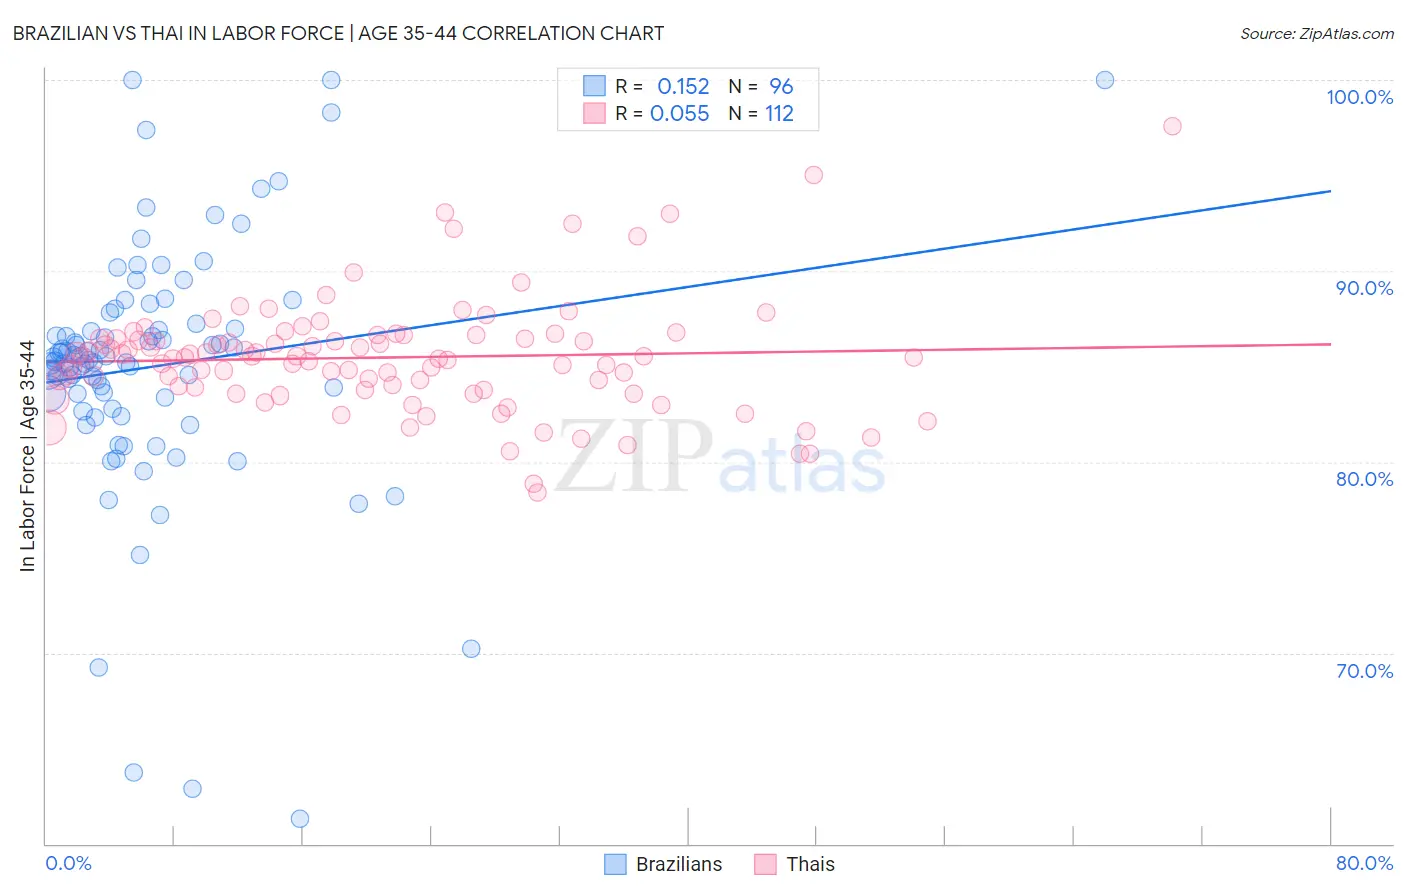
Brazilian vs Thai In Labor Force | Age 35-44 Correlation Chart
The statistical analysis conducted on geographies consisting of 323,788,693 people shows a poor positive correlation between the proportion of Brazilians and labor force participation rate among population between the ages 35 and 44 in the United States with a correlation coefficient (R) of 0.152 and weighted average of 85.0%. Similarly, the statistical analysis conducted on geographies consisting of 475,470,892 people shows a slight positive correlation between the proportion of Thais and labor force participation rate among population between the ages 35 and 44 in the United States with a correlation coefficient (R) of 0.055 and weighted average of 85.2%, a difference of 0.18%.
In Labor Force | Age 35-44 Correlation Summary
| Measurement | Brazilian | Thai |
| Minimum | 61.3% | 78.4% |
| Maximum | 100.0% | 97.6% |
| Range | 38.7% | 19.2% |
| Mean | 85.0% | 85.5% |
| Median | 85.4% | 85.5% |
| Interquartile 25% (IQ1) | 83.1% | 83.8% |
| Interquartile 75% (IQ3) | 87.1% | 86.5% |
| Interquartile Range (IQR) | 4.0% | 2.7% |
| Standard Deviation (Sample) | 6.6% | 3.0% |
| Standard Deviation (Population) | 6.6% | 3.0% |
Demographics Similar to Brazilians and Thais by In Labor Force | Age 35-44
In terms of in labor force | age 35-44, the demographic groups most similar to Brazilians are Sudanese (85.0%, a difference of 0.0%), Italian (85.0%, a difference of 0.010%), Immigrants from Haiti (85.0%, a difference of 0.020%), Immigrants from Italy (85.0%, a difference of 0.020%), and Immigrants from Brazil (85.0%, a difference of 0.030%). Similarly, the demographic groups most similar to Thais are Immigrants from Albania (85.1%, a difference of 0.0%), Immigrants from Kenya (85.1%, a difference of 0.040%), Taiwanese (85.1%, a difference of 0.050%), Turkish (85.1%, a difference of 0.060%), and Soviet Union (85.1%, a difference of 0.070%).
| Demographics | Rating | Rank | In Labor Force | Age 35-44 |
| Thais | 99.7 /100 | #50 | Exceptional 85.2% |
| Immigrants | Albania | 99.7 /100 | #51 | Exceptional 85.1% |
| Immigrants | Kenya | 99.6 /100 | #52 | Exceptional 85.1% |
| Taiwanese | 99.6 /100 | #53 | Exceptional 85.1% |
| Turks | 99.5 /100 | #54 | Exceptional 85.1% |
| Soviet Union | 99.5 /100 | #55 | Exceptional 85.1% |
| Immigrants | Croatia | 99.5 /100 | #56 | Exceptional 85.1% |
| Chinese | 99.4 /100 | #57 | Exceptional 85.1% |
| Slovaks | 99.4 /100 | #58 | Exceptional 85.1% |
| Serbians | 99.4 /100 | #59 | Exceptional 85.1% |
| Albanians | 99.4 /100 | #60 | Exceptional 85.1% |
| Immigrants | Latvia | 99.3 /100 | #61 | Exceptional 85.0% |
| Immigrants | Moldova | 99.3 /100 | #62 | Exceptional 85.0% |
| Immigrants | Uganda | 99.3 /100 | #63 | Exceptional 85.0% |
| Swedes | 99.2 /100 | #64 | Exceptional 85.0% |
| Immigrants | Brazil | 99.2 /100 | #65 | Exceptional 85.0% |
| Immigrants | Haiti | 99.1 /100 | #66 | Exceptional 85.0% |
| Immigrants | Italy | 99.1 /100 | #67 | Exceptional 85.0% |
| Italians | 99.1 /100 | #68 | Exceptional 85.0% |
| Sudanese | 99.0 /100 | #69 | Exceptional 85.0% |
| Brazilians | 99.0 /100 | #70 | Exceptional 85.0% |