Immigrants from Pakistan vs Thai In Labor Force | Age 35-44
COMPARE
Immigrants from Pakistan
Thai
In Labor Force | Age 35-44
In Labor Force | Age 35-44 Comparison
Immigrants from Pakistan
Thais
84.9%
IN LABOR FORCE | AGE 35-44
97.5/ 100
METRIC RATING
89th/ 347
METRIC RANK
85.2%
IN LABOR FORCE | AGE 35-44
99.7/ 100
METRIC RATING
50th/ 347
METRIC RANK
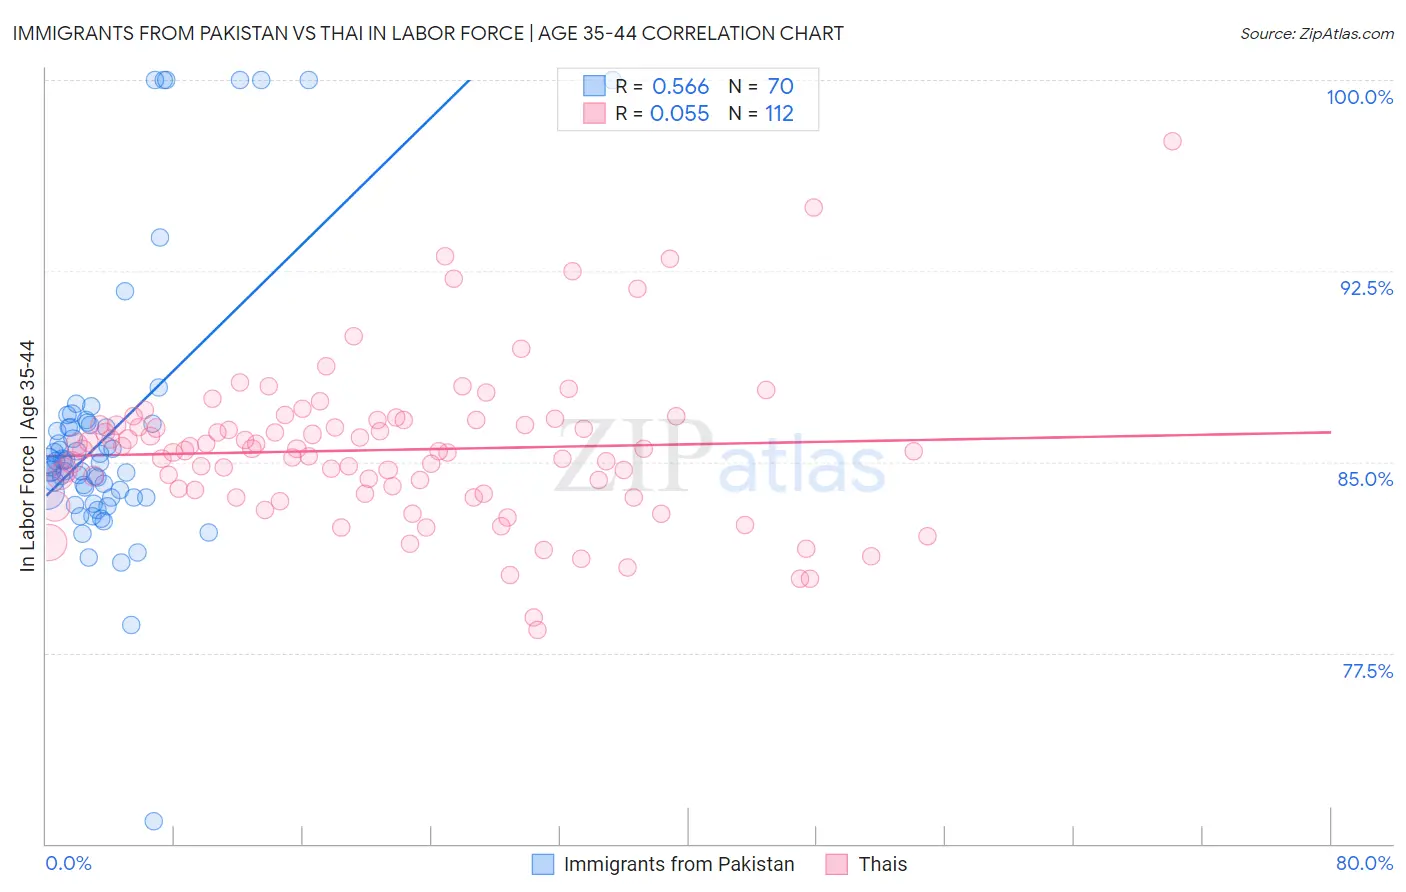
Immigrants from Pakistan vs Thai In Labor Force | Age 35-44 Correlation Chart
The statistical analysis conducted on geographies consisting of 283,833,704 people shows a substantial positive correlation between the proportion of Immigrants from Pakistan and labor force participation rate among population between the ages 35 and 44 in the United States with a correlation coefficient (R) of 0.566 and weighted average of 84.9%. Similarly, the statistical analysis conducted on geographies consisting of 475,470,892 people shows a slight positive correlation between the proportion of Thais and labor force participation rate among population between the ages 35 and 44 in the United States with a correlation coefficient (R) of 0.055 and weighted average of 85.2%, a difference of 0.34%.
In Labor Force | Age 35-44 Correlation Summary
| Measurement | Immigrants from Pakistan | Thai |
| Minimum | 70.9% | 78.4% |
| Maximum | 100.0% | 97.6% |
| Range | 29.1% | 19.2% |
| Mean | 86.1% | 85.5% |
| Median | 85.0% | 85.5% |
| Interquartile 25% (IQ1) | 83.6% | 83.8% |
| Interquartile 75% (IQ3) | 86.4% | 86.5% |
| Interquartile Range (IQR) | 2.8% | 2.7% |
| Standard Deviation (Sample) | 5.4% | 3.0% |
| Standard Deviation (Population) | 5.3% | 3.0% |
Similar Demographics by In Labor Force | Age 35-44
Demographics Similar to Immigrants from Pakistan by In Labor Force | Age 35-44
In terms of in labor force | age 35-44, the demographic groups most similar to Immigrants from Pakistan are Immigrants from France (84.9%, a difference of 0.0%), Senegalese (84.9%, a difference of 0.020%), Immigrants from Peru (84.9%, a difference of 0.020%), Immigrants from Middle Africa (84.9%, a difference of 0.020%), and Greek (84.9%, a difference of 0.020%).
| Demographics | Rating | Rank | In Labor Force | Age 35-44 |
| Immigrants | Sudan | 98.1 /100 | #82 | Exceptional 84.9% |
| Senegalese | 97.8 /100 | #83 | Exceptional 84.9% |
| Immigrants | Peru | 97.8 /100 | #84 | Exceptional 84.9% |
| Immigrants | Middle Africa | 97.8 /100 | #85 | Exceptional 84.9% |
| Greeks | 97.8 /100 | #86 | Exceptional 84.9% |
| Belgians | 97.7 /100 | #87 | Exceptional 84.9% |
| Yugoslavians | 97.7 /100 | #88 | Exceptional 84.9% |
| Immigrants | Pakistan | 97.5 /100 | #89 | Exceptional 84.9% |
| Immigrants | France | 97.4 /100 | #90 | Exceptional 84.9% |
| Immigrants | Europe | 97.2 /100 | #91 | Exceptional 84.9% |
| Ghanaians | 97.2 /100 | #92 | Exceptional 84.8% |
| Immigrants | Northern Africa | 97.1 /100 | #93 | Exceptional 84.8% |
| Mongolians | 96.8 /100 | #94 | Exceptional 84.8% |
| Immigrants | Kuwait | 96.7 /100 | #95 | Exceptional 84.8% |
| Cubans | 96.6 /100 | #96 | Exceptional 84.8% |
Demographics Similar to Thais by In Labor Force | Age 35-44
In terms of in labor force | age 35-44, the demographic groups most similar to Thais are Immigrants from Albania (85.1%, a difference of 0.0%), Immigrants from Eritrea (85.2%, a difference of 0.030%), Croatian (85.2%, a difference of 0.030%), German Russian (85.2%, a difference of 0.040%), and Immigrants from Kenya (85.1%, a difference of 0.040%).
| Demographics | Rating | Rank | In Labor Force | Age 35-44 |
| Poles | 99.8 /100 | #43 | Exceptional 85.2% |
| Lithuanians | 99.8 /100 | #44 | Exceptional 85.2% |
| Cypriots | 99.8 /100 | #45 | Exceptional 85.2% |
| Immigrants | Hong Kong | 99.8 /100 | #46 | Exceptional 85.2% |
| German Russians | 99.8 /100 | #47 | Exceptional 85.2% |
| Immigrants | Eritrea | 99.7 /100 | #48 | Exceptional 85.2% |
| Croatians | 99.7 /100 | #49 | Exceptional 85.2% |
| Thais | 99.7 /100 | #50 | Exceptional 85.2% |
| Immigrants | Albania | 99.7 /100 | #51 | Exceptional 85.1% |
| Immigrants | Kenya | 99.6 /100 | #52 | Exceptional 85.1% |
| Taiwanese | 99.6 /100 | #53 | Exceptional 85.1% |
| Turks | 99.5 /100 | #54 | Exceptional 85.1% |
| Soviet Union | 99.5 /100 | #55 | Exceptional 85.1% |
| Immigrants | Croatia | 99.5 /100 | #56 | Exceptional 85.1% |
| Chinese | 99.4 /100 | #57 | Exceptional 85.1% |