Honduran vs Immigrants from West Indies In Labor Force | Age 16-19
COMPARE
Honduran
Immigrants from West Indies
In Labor Force | Age 16-19
In Labor Force | Age 16-19 Comparison
Hondurans
Immigrants from West Indies
35.3%
IN LABOR FORCE | AGE 16-19
6.5/ 100
METRIC RATING
224th/ 347
METRIC RANK
31.7%
IN LABOR FORCE | AGE 16-19
0.0/ 100
METRIC RATING
315th/ 347
METRIC RANK
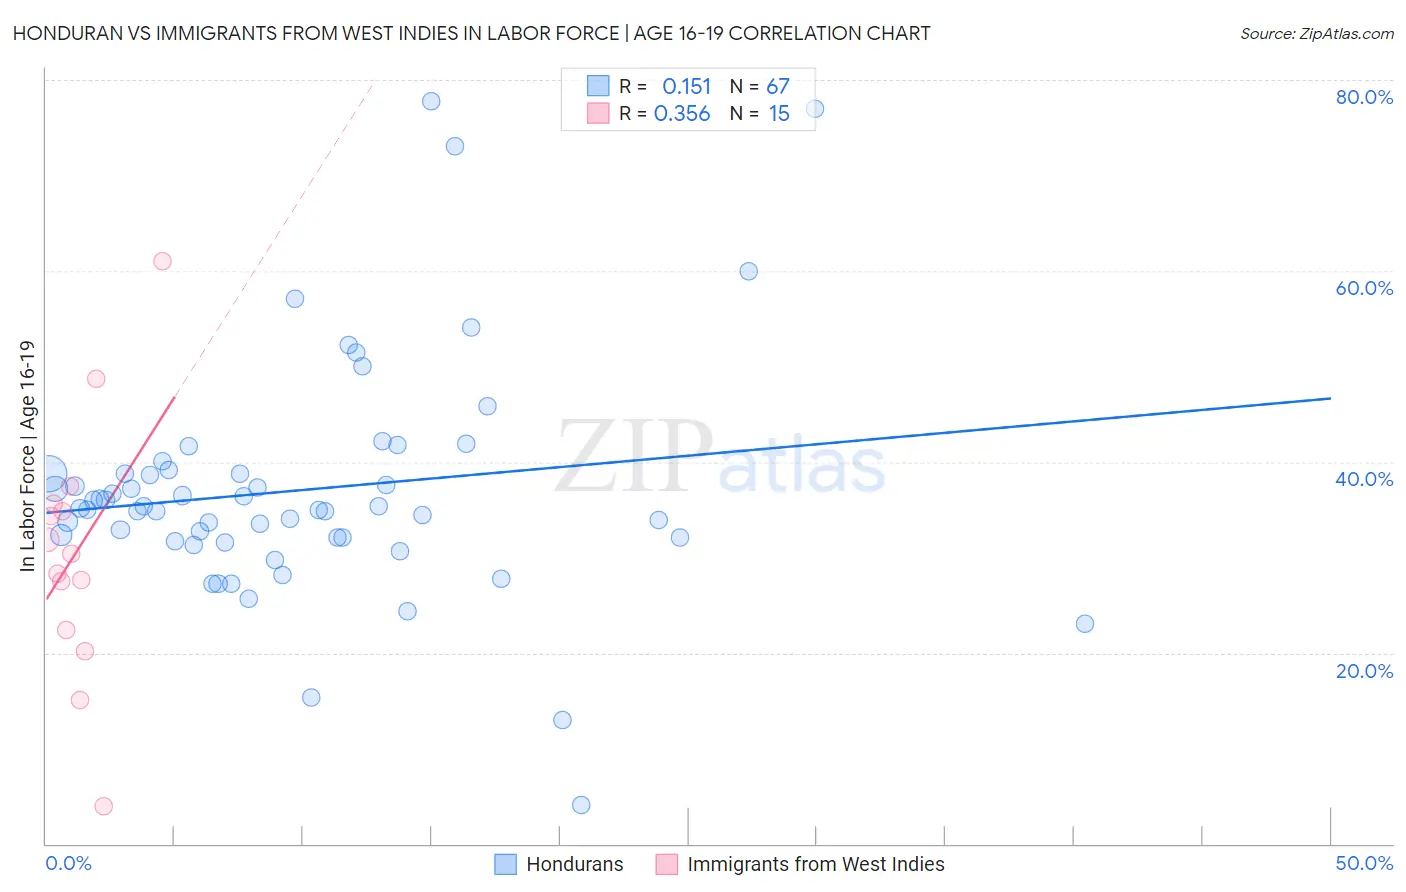
Honduran vs Immigrants from West Indies In Labor Force | Age 16-19 Correlation Chart
The statistical analysis conducted on geographies consisting of 357,451,024 people shows a poor positive correlation between the proportion of Hondurans and labor force participation rate among population between the ages 16 and 19 in the United States with a correlation coefficient (R) of 0.151 and weighted average of 35.3%. Similarly, the statistical analysis conducted on geographies consisting of 72,428,382 people shows a mild positive correlation between the proportion of Immigrants from West Indies and labor force participation rate among population between the ages 16 and 19 in the United States with a correlation coefficient (R) of 0.356 and weighted average of 31.7%, a difference of 11.5%.
In Labor Force | Age 16-19 Correlation Summary
| Measurement | Honduran | Immigrants from West Indies |
| Minimum | 4.1% | 3.9% |
| Maximum | 77.8% | 61.0% |
| Range | 73.7% | 57.1% |
| Mean | 37.0% | 30.6% |
| Median | 35.1% | 30.4% |
| Interquartile 25% (IQ1) | 32.0% | 22.4% |
| Interquartile 75% (IQ3) | 38.8% | 35.6% |
| Interquartile Range (IQR) | 6.8% | 13.3% |
| Standard Deviation (Sample) | 12.4% | 13.4% |
| Standard Deviation (Population) | 12.3% | 12.9% |
Similar Demographics by In Labor Force | Age 16-19
Demographics Similar to Hondurans by In Labor Force | Age 16-19
In terms of in labor force | age 16-19, the demographic groups most similar to Hondurans are Ghanaian (35.3%, a difference of 0.020%), Immigrants from Belgium (35.3%, a difference of 0.080%), Immigrants from Ghana (35.4%, a difference of 0.16%), Turkish (35.4%, a difference of 0.17%), and Immigrants from Guatemala (35.3%, a difference of 0.17%).
| Demographics | Rating | Rank | In Labor Force | Age 16-19 |
| Immigrants | Costa Rica | 10.7 /100 | #217 | Poor 35.6% |
| Sri Lankans | 9.8 /100 | #218 | Tragic 35.5% |
| Guatemalans | 8.6 /100 | #219 | Tragic 35.5% |
| Immigrants | Bahamas | 8.3 /100 | #220 | Tragic 35.5% |
| Turks | 7.3 /100 | #221 | Tragic 35.4% |
| Immigrants | Ghana | 7.3 /100 | #222 | Tragic 35.4% |
| Ghanaians | 6.5 /100 | #223 | Tragic 35.3% |
| Hondurans | 6.5 /100 | #224 | Tragic 35.3% |
| Immigrants | Belgium | 6.1 /100 | #225 | Tragic 35.3% |
| Immigrants | Guatemala | 5.7 /100 | #226 | Tragic 35.3% |
| Mongolians | 5.7 /100 | #227 | Tragic 35.3% |
| Immigrants | Senegal | 5.5 /100 | #228 | Tragic 35.3% |
| Immigrants | Lebanon | 5.0 /100 | #229 | Tragic 35.2% |
| Immigrants | Honduras | 4.9 /100 | #230 | Tragic 35.2% |
| Immigrants | Syria | 4.5 /100 | #231 | Tragic 35.2% |
Demographics Similar to Immigrants from West Indies by In Labor Force | Age 16-19
In terms of in labor force | age 16-19, the demographic groups most similar to Immigrants from West Indies are Filipino (31.7%, a difference of 0.080%), Cuban (31.8%, a difference of 0.18%), Immigrants from Nicaragua (31.6%, a difference of 0.28%), Immigrants from Belize (31.8%, a difference of 0.34%), and Hopi (31.8%, a difference of 0.34%).
| Demographics | Rating | Rank | In Labor Force | Age 16-19 |
| Navajo | 0.0 /100 | #308 | Tragic 32.1% |
| Immigrants | Eastern Asia | 0.0 /100 | #309 | Tragic 32.0% |
| Immigrants | Iran | 0.0 /100 | #310 | Tragic 32.0% |
| Indians (Asian) | 0.0 /100 | #311 | Tragic 31.9% |
| Immigrants | Belize | 0.0 /100 | #312 | Tragic 31.8% |
| Hopi | 0.0 /100 | #313 | Tragic 31.8% |
| Cubans | 0.0 /100 | #314 | Tragic 31.8% |
| Immigrants | West Indies | 0.0 /100 | #315 | Tragic 31.7% |
| Filipinos | 0.0 /100 | #316 | Tragic 31.7% |
| Immigrants | Nicaragua | 0.0 /100 | #317 | Tragic 31.6% |
| Immigrants | Yemen | 0.0 /100 | #318 | Tragic 31.5% |
| Soviet Union | 0.0 /100 | #319 | Tragic 31.4% |
| Ecuadorians | 0.0 /100 | #320 | Tragic 31.4% |
| West Indians | 0.0 /100 | #321 | Tragic 31.3% |
| Tohono O'odham | 0.0 /100 | #322 | Tragic 31.3% |