Honduran vs Native/Alaskan In Labor Force | Age 16-19
COMPARE
Honduran
Native/Alaskan
In Labor Force | Age 16-19
In Labor Force | Age 16-19 Comparison
Hondurans
Natives/Alaskans
35.3%
IN LABOR FORCE | AGE 16-19
6.5/ 100
METRIC RATING
224th/ 347
METRIC RANK
36.6%
IN LABOR FORCE | AGE 16-19
49.0/ 100
METRIC RATING
175th/ 347
METRIC RANK
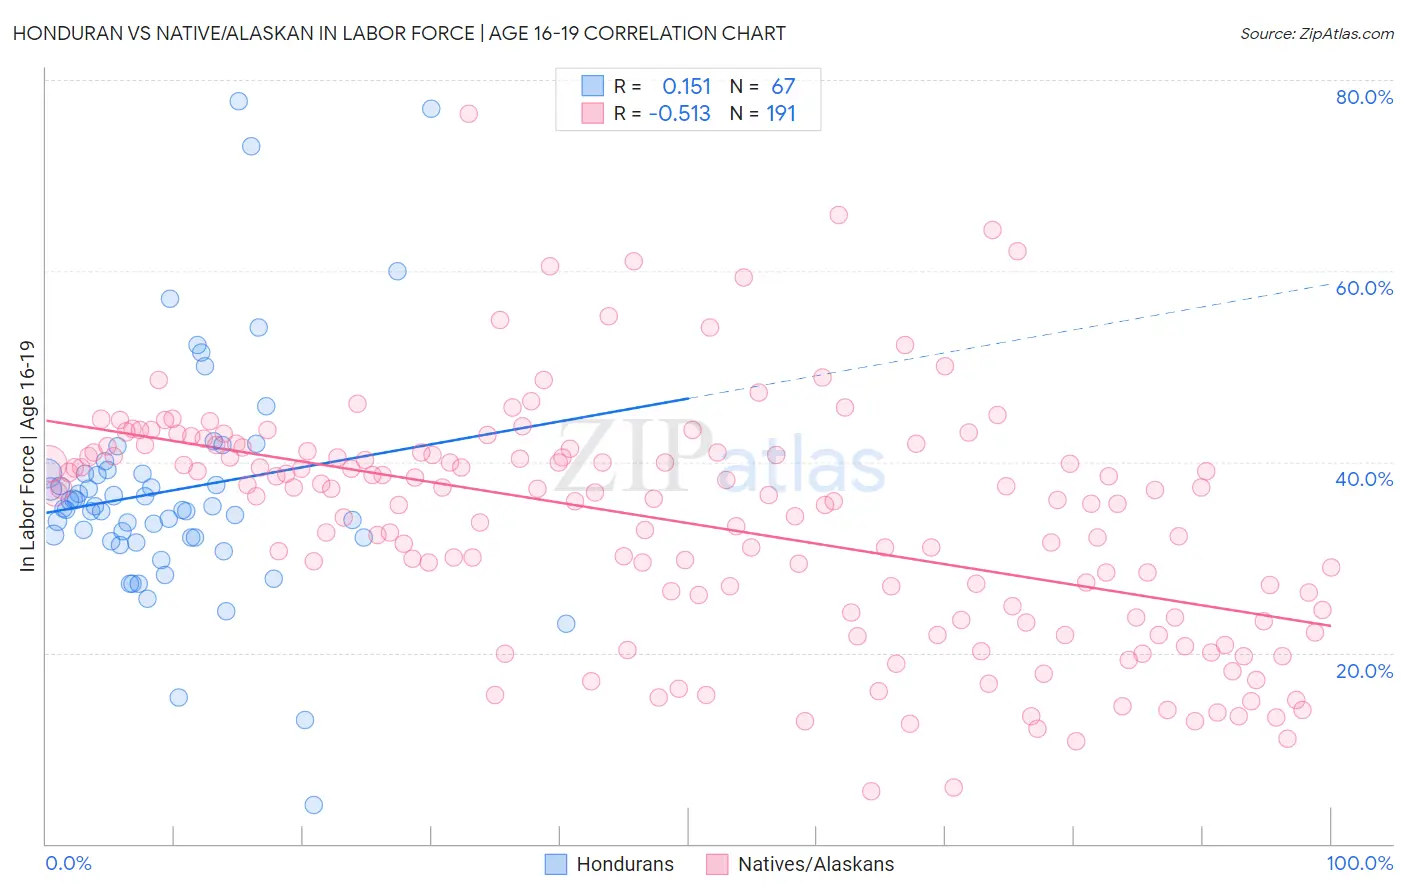
Honduran vs Native/Alaskan In Labor Force | Age 16-19 Correlation Chart
The statistical analysis conducted on geographies consisting of 357,451,024 people shows a poor positive correlation between the proportion of Hondurans and labor force participation rate among population between the ages 16 and 19 in the United States with a correlation coefficient (R) of 0.151 and weighted average of 35.3%. Similarly, the statistical analysis conducted on geographies consisting of 511,038,872 people shows a substantial negative correlation between the proportion of Natives/Alaskans and labor force participation rate among population between the ages 16 and 19 in the United States with a correlation coefficient (R) of -0.513 and weighted average of 36.6%, a difference of 3.4%.
In Labor Force | Age 16-19 Correlation Summary
| Measurement | Honduran | Native/Alaskan |
| Minimum | 4.1% | 5.5% |
| Maximum | 77.8% | 76.4% |
| Range | 73.7% | 70.9% |
| Mean | 37.0% | 33.6% |
| Median | 35.1% | 36.4% |
| Interquartile 25% (IQ1) | 32.0% | 23.7% |
| Interquartile 75% (IQ3) | 38.8% | 41.0% |
| Interquartile Range (IQR) | 6.8% | 17.3% |
| Standard Deviation (Sample) | 12.4% | 12.4% |
| Standard Deviation (Population) | 12.3% | 12.3% |
Similar Demographics by In Labor Force | Age 16-19
Demographics Similar to Hondurans by In Labor Force | Age 16-19
In terms of in labor force | age 16-19, the demographic groups most similar to Hondurans are Ghanaian (35.3%, a difference of 0.020%), Immigrants from Belgium (35.3%, a difference of 0.080%), Immigrants from Ghana (35.4%, a difference of 0.16%), Turkish (35.4%, a difference of 0.17%), and Immigrants from Guatemala (35.3%, a difference of 0.17%).
| Demographics | Rating | Rank | In Labor Force | Age 16-19 |
| Immigrants | Costa Rica | 10.7 /100 | #217 | Poor 35.6% |
| Sri Lankans | 9.8 /100 | #218 | Tragic 35.5% |
| Guatemalans | 8.6 /100 | #219 | Tragic 35.5% |
| Immigrants | Bahamas | 8.3 /100 | #220 | Tragic 35.5% |
| Turks | 7.3 /100 | #221 | Tragic 35.4% |
| Immigrants | Ghana | 7.3 /100 | #222 | Tragic 35.4% |
| Ghanaians | 6.5 /100 | #223 | Tragic 35.3% |
| Hondurans | 6.5 /100 | #224 | Tragic 35.3% |
| Immigrants | Belgium | 6.1 /100 | #225 | Tragic 35.3% |
| Immigrants | Guatemala | 5.7 /100 | #226 | Tragic 35.3% |
| Mongolians | 5.7 /100 | #227 | Tragic 35.3% |
| Immigrants | Senegal | 5.5 /100 | #228 | Tragic 35.3% |
| Immigrants | Lebanon | 5.0 /100 | #229 | Tragic 35.2% |
| Immigrants | Honduras | 4.9 /100 | #230 | Tragic 35.2% |
| Immigrants | Syria | 4.5 /100 | #231 | Tragic 35.2% |
Demographics Similar to Natives/Alaskans by In Labor Force | Age 16-19
In terms of in labor force | age 16-19, the demographic groups most similar to Natives/Alaskans are Albanian (36.5%, a difference of 0.010%), Immigrants from Czechoslovakia (36.6%, a difference of 0.050%), Immigrants from Northern Europe (36.5%, a difference of 0.12%), Black/African American (36.5%, a difference of 0.20%), and Immigrants from Southern Europe (36.4%, a difference of 0.29%).
| Demographics | Rating | Rank | In Labor Force | Age 16-19 |
| Palestinians | 63.1 /100 | #168 | Good 36.8% |
| Immigrants | Latvia | 61.6 /100 | #169 | Good 36.8% |
| Immigrants | South Africa | 60.5 /100 | #170 | Good 36.8% |
| Immigrants | Cambodia | 58.4 /100 | #171 | Average 36.7% |
| South Africans | 58.3 /100 | #172 | Average 36.7% |
| Russians | 57.5 /100 | #173 | Average 36.7% |
| Immigrants | Czechoslovakia | 50.0 /100 | #174 | Average 36.6% |
| Natives/Alaskans | 49.0 /100 | #175 | Average 36.6% |
| Albanians | 48.8 /100 | #176 | Average 36.5% |
| Immigrants | Northern Europe | 46.6 /100 | #177 | Average 36.5% |
| Blacks/African Americans | 45.1 /100 | #178 | Average 36.5% |
| Immigrants | Southern Europe | 43.3 /100 | #179 | Average 36.4% |
| Immigrants | Morocco | 41.1 /100 | #180 | Average 36.4% |
| Jordanians | 39.6 /100 | #181 | Fair 36.4% |
| Immigrants | Italy | 39.1 /100 | #182 | Fair 36.4% |