Immigrants from Western Asia vs Immigrants from West Indies In Labor Force | Age 16-19
COMPARE
Immigrants from Western Asia
Immigrants from West Indies
In Labor Force | Age 16-19
In Labor Force | Age 16-19 Comparison
Immigrants from Western Asia
Immigrants from West Indies
34.8%
IN LABOR FORCE | AGE 16-19
2.0/ 100
METRIC RATING
251st/ 347
METRIC RANK
31.7%
IN LABOR FORCE | AGE 16-19
0.0/ 100
METRIC RATING
315th/ 347
METRIC RANK
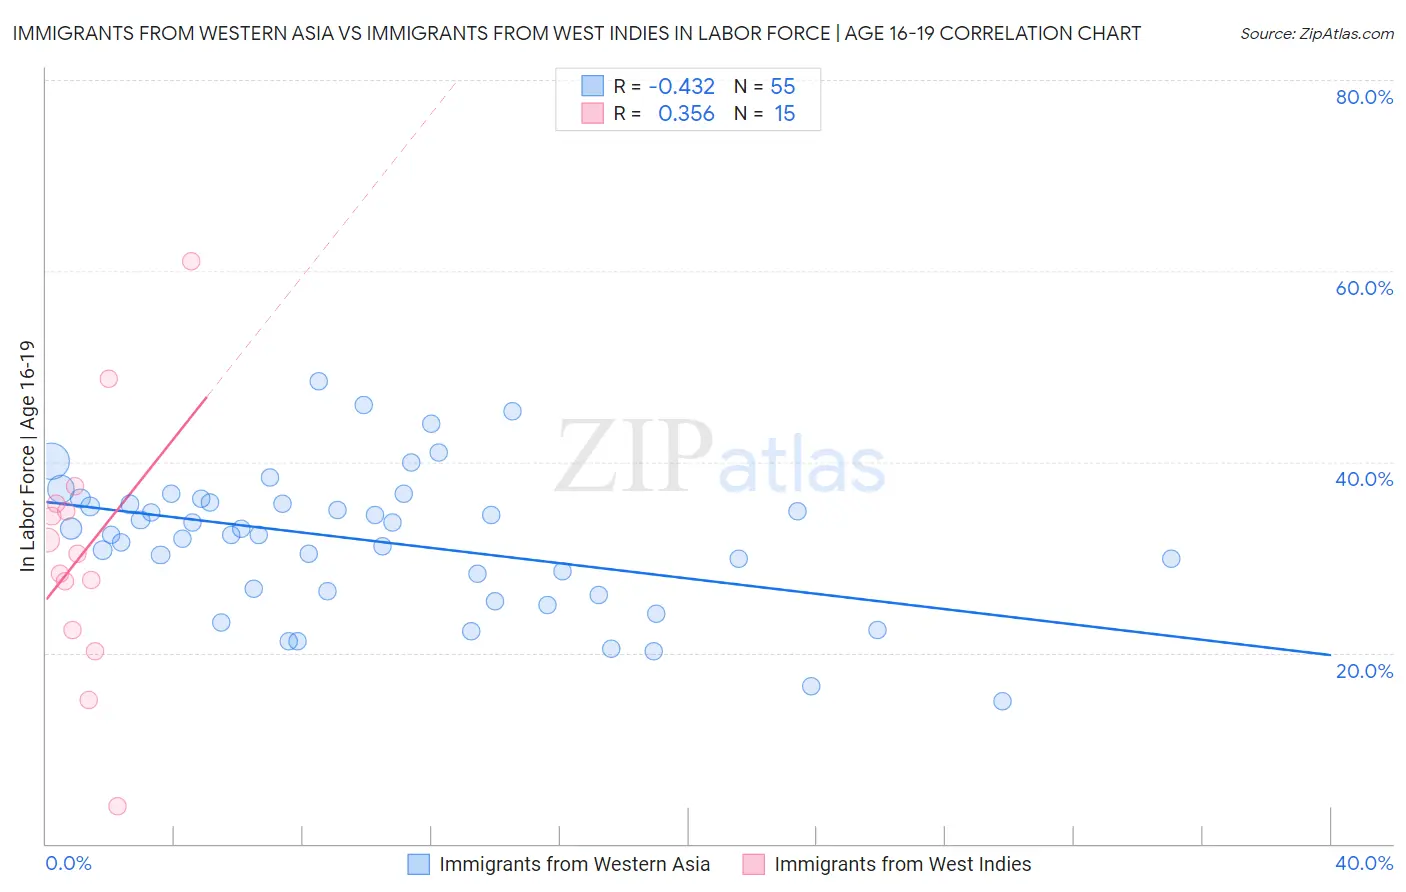
Immigrants from Western Asia vs Immigrants from West Indies In Labor Force | Age 16-19 Correlation Chart
The statistical analysis conducted on geographies consisting of 403,680,929 people shows a moderate negative correlation between the proportion of Immigrants from Western Asia and labor force participation rate among population between the ages 16 and 19 in the United States with a correlation coefficient (R) of -0.432 and weighted average of 34.8%. Similarly, the statistical analysis conducted on geographies consisting of 72,428,382 people shows a mild positive correlation between the proportion of Immigrants from West Indies and labor force participation rate among population between the ages 16 and 19 in the United States with a correlation coefficient (R) of 0.356 and weighted average of 31.7%, a difference of 9.7%.
In Labor Force | Age 16-19 Correlation Summary
| Measurement | Immigrants from Western Asia | Immigrants from West Indies |
| Minimum | 14.9% | 3.9% |
| Maximum | 48.4% | 61.0% |
| Range | 33.5% | 57.1% |
| Mean | 31.7% | 30.6% |
| Median | 32.4% | 30.4% |
| Interquartile 25% (IQ1) | 26.4% | 22.4% |
| Interquartile 75% (IQ3) | 35.7% | 35.6% |
| Interquartile Range (IQR) | 9.3% | 13.3% |
| Standard Deviation (Sample) | 7.2% | 13.4% |
| Standard Deviation (Population) | 7.2% | 12.9% |
Similar Demographics by In Labor Force | Age 16-19
Demographics Similar to Immigrants from Western Asia by In Labor Force | Age 16-19
In terms of in labor force | age 16-19, the demographic groups most similar to Immigrants from Western Asia are Immigrants from Chile (34.8%, a difference of 0.010%), Immigrants from Pakistan (34.8%, a difference of 0.020%), Immigrants from Ukraine (34.8%, a difference of 0.12%), Central American (34.8%, a difference of 0.15%), and Laotian (34.9%, a difference of 0.23%).
| Demographics | Rating | Rank | In Labor Force | Age 16-19 |
| Immigrants | Turkey | 2.6 /100 | #244 | Tragic 34.9% |
| Immigrants | Greece | 2.4 /100 | #245 | Tragic 34.9% |
| Immigrants | Sri Lanka | 2.4 /100 | #246 | Tragic 34.9% |
| Laotians | 2.4 /100 | #247 | Tragic 34.9% |
| Central Americans | 2.2 /100 | #248 | Tragic 34.8% |
| Immigrants | Ukraine | 2.2 /100 | #249 | Tragic 34.8% |
| Immigrants | Pakistan | 2.0 /100 | #250 | Tragic 34.8% |
| Immigrants | Western Asia | 2.0 /100 | #251 | Tragic 34.8% |
| Immigrants | Chile | 2.0 /100 | #252 | Tragic 34.8% |
| Immigrants | Japan | 1.5 /100 | #253 | Tragic 34.7% |
| Bahamians | 1.4 /100 | #254 | Tragic 34.6% |
| Peruvians | 1.4 /100 | #255 | Tragic 34.6% |
| Immigrants | South Central Asia | 1.3 /100 | #256 | Tragic 34.6% |
| Immigrants | Egypt | 1.2 /100 | #257 | Tragic 34.6% |
| Thais | 1.2 /100 | #258 | Tragic 34.6% |
Demographics Similar to Immigrants from West Indies by In Labor Force | Age 16-19
In terms of in labor force | age 16-19, the demographic groups most similar to Immigrants from West Indies are Filipino (31.7%, a difference of 0.080%), Cuban (31.8%, a difference of 0.18%), Immigrants from Nicaragua (31.6%, a difference of 0.28%), Immigrants from Belize (31.8%, a difference of 0.34%), and Hopi (31.8%, a difference of 0.34%).
| Demographics | Rating | Rank | In Labor Force | Age 16-19 |
| Navajo | 0.0 /100 | #308 | Tragic 32.1% |
| Immigrants | Eastern Asia | 0.0 /100 | #309 | Tragic 32.0% |
| Immigrants | Iran | 0.0 /100 | #310 | Tragic 32.0% |
| Indians (Asian) | 0.0 /100 | #311 | Tragic 31.9% |
| Immigrants | Belize | 0.0 /100 | #312 | Tragic 31.8% |
| Hopi | 0.0 /100 | #313 | Tragic 31.8% |
| Cubans | 0.0 /100 | #314 | Tragic 31.8% |
| Immigrants | West Indies | 0.0 /100 | #315 | Tragic 31.7% |
| Filipinos | 0.0 /100 | #316 | Tragic 31.7% |
| Immigrants | Nicaragua | 0.0 /100 | #317 | Tragic 31.6% |
| Immigrants | Yemen | 0.0 /100 | #318 | Tragic 31.5% |
| Soviet Union | 0.0 /100 | #319 | Tragic 31.4% |
| Ecuadorians | 0.0 /100 | #320 | Tragic 31.4% |
| West Indians | 0.0 /100 | #321 | Tragic 31.3% |
| Tohono O'odham | 0.0 /100 | #322 | Tragic 31.3% |