Serbian vs Immigrants from West Indies In Labor Force | Age 16-19
COMPARE
Serbian
Immigrants from West Indies
In Labor Force | Age 16-19
In Labor Force | Age 16-19 Comparison
Serbians
Immigrants from West Indies
39.9%
IN LABOR FORCE | AGE 16-19
99.9/ 100
METRIC RATING
71st/ 347
METRIC RANK
31.7%
IN LABOR FORCE | AGE 16-19
0.0/ 100
METRIC RATING
315th/ 347
METRIC RANK
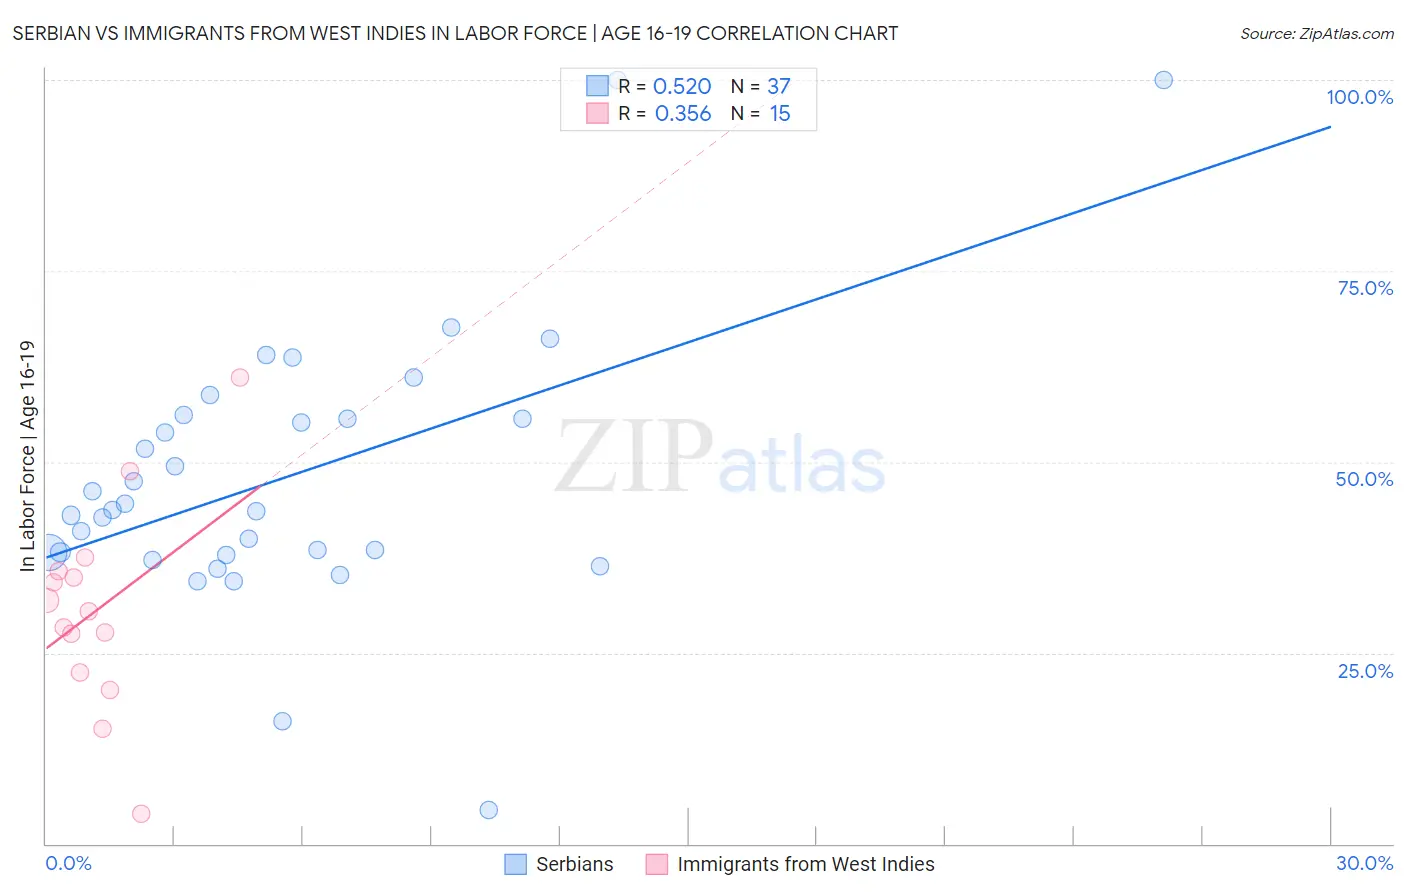
Serbian vs Immigrants from West Indies In Labor Force | Age 16-19 Correlation Chart
The statistical analysis conducted on geographies consisting of 267,337,384 people shows a substantial positive correlation between the proportion of Serbians and labor force participation rate among population between the ages 16 and 19 in the United States with a correlation coefficient (R) of 0.520 and weighted average of 39.9%. Similarly, the statistical analysis conducted on geographies consisting of 72,428,382 people shows a mild positive correlation between the proportion of Immigrants from West Indies and labor force participation rate among population between the ages 16 and 19 in the United States with a correlation coefficient (R) of 0.356 and weighted average of 31.7%, a difference of 26.0%.
In Labor Force | Age 16-19 Correlation Summary
| Measurement | Serbian | Immigrants from West Indies |
| Minimum | 4.4% | 3.9% |
| Maximum | 100.0% | 61.0% |
| Range | 95.6% | 57.1% |
| Mean | 48.0% | 30.6% |
| Median | 43.6% | 30.4% |
| Interquartile 25% (IQ1) | 37.9% | 22.4% |
| Interquartile 75% (IQ3) | 55.9% | 35.6% |
| Interquartile Range (IQR) | 18.0% | 13.3% |
| Standard Deviation (Sample) | 18.1% | 13.4% |
| Standard Deviation (Population) | 17.8% | 12.9% |
Similar Demographics by In Labor Force | Age 16-19
Demographics Similar to Serbians by In Labor Force | Age 16-19
In terms of in labor force | age 16-19, the demographic groups most similar to Serbians are Iroquois (39.9%, a difference of 0.010%), Immigrants from Middle Africa (39.9%, a difference of 0.040%), Portuguese (40.0%, a difference of 0.17%), Potawatomi (40.0%, a difference of 0.22%), and Hungarian (39.8%, a difference of 0.27%).
| Demographics | Rating | Rank | In Labor Force | Age 16-19 |
| Immigrants | Micronesia | 100.0 /100 | #64 | Exceptional 40.2% |
| Kenyans | 100.0 /100 | #65 | Exceptional 40.1% |
| Immigrants | Nonimmigrants | 100.0 /100 | #66 | Exceptional 40.1% |
| Canadians | 100.0 /100 | #67 | Exceptional 40.1% |
| Italians | 99.9 /100 | #68 | Exceptional 40.1% |
| Potawatomi | 99.9 /100 | #69 | Exceptional 40.0% |
| Portuguese | 99.9 /100 | #70 | Exceptional 40.0% |
| Serbians | 99.9 /100 | #71 | Exceptional 39.9% |
| Iroquois | 99.9 /100 | #72 | Exceptional 39.9% |
| Immigrants | Middle Africa | 99.9 /100 | #73 | Exceptional 39.9% |
| Hungarians | 99.9 /100 | #74 | Exceptional 39.8% |
| French American Indians | 99.9 /100 | #75 | Exceptional 39.8% |
| Malaysians | 99.9 /100 | #76 | Exceptional 39.7% |
| Immigrants | Portugal | 99.9 /100 | #77 | Exceptional 39.7% |
| Austrians | 99.8 /100 | #78 | Exceptional 39.5% |
Demographics Similar to Immigrants from West Indies by In Labor Force | Age 16-19
In terms of in labor force | age 16-19, the demographic groups most similar to Immigrants from West Indies are Filipino (31.7%, a difference of 0.080%), Cuban (31.8%, a difference of 0.18%), Immigrants from Nicaragua (31.6%, a difference of 0.28%), Immigrants from Belize (31.8%, a difference of 0.34%), and Hopi (31.8%, a difference of 0.34%).
| Demographics | Rating | Rank | In Labor Force | Age 16-19 |
| Navajo | 0.0 /100 | #308 | Tragic 32.1% |
| Immigrants | Eastern Asia | 0.0 /100 | #309 | Tragic 32.0% |
| Immigrants | Iran | 0.0 /100 | #310 | Tragic 32.0% |
| Indians (Asian) | 0.0 /100 | #311 | Tragic 31.9% |
| Immigrants | Belize | 0.0 /100 | #312 | Tragic 31.8% |
| Hopi | 0.0 /100 | #313 | Tragic 31.8% |
| Cubans | 0.0 /100 | #314 | Tragic 31.8% |
| Immigrants | West Indies | 0.0 /100 | #315 | Tragic 31.7% |
| Filipinos | 0.0 /100 | #316 | Tragic 31.7% |
| Immigrants | Nicaragua | 0.0 /100 | #317 | Tragic 31.6% |
| Immigrants | Yemen | 0.0 /100 | #318 | Tragic 31.5% |
| Soviet Union | 0.0 /100 | #319 | Tragic 31.4% |
| Ecuadorians | 0.0 /100 | #320 | Tragic 31.4% |
| West Indians | 0.0 /100 | #321 | Tragic 31.3% |
| Tohono O'odham | 0.0 /100 | #322 | Tragic 31.3% |