Bhutanese vs Immigrants from Kenya In Labor Force | Age 30-34
COMPARE
Bhutanese
Immigrants from Kenya
In Labor Force | Age 30-34
In Labor Force | Age 30-34 Comparison
Bhutanese
Immigrants from Kenya
85.0%
IN LABOR FORCE | AGE 30-34
87.5/ 100
METRIC RATING
139th/ 347
METRIC RANK
85.5%
IN LABOR FORCE | AGE 30-34
99.6/ 100
METRIC RATING
54th/ 347
METRIC RANK
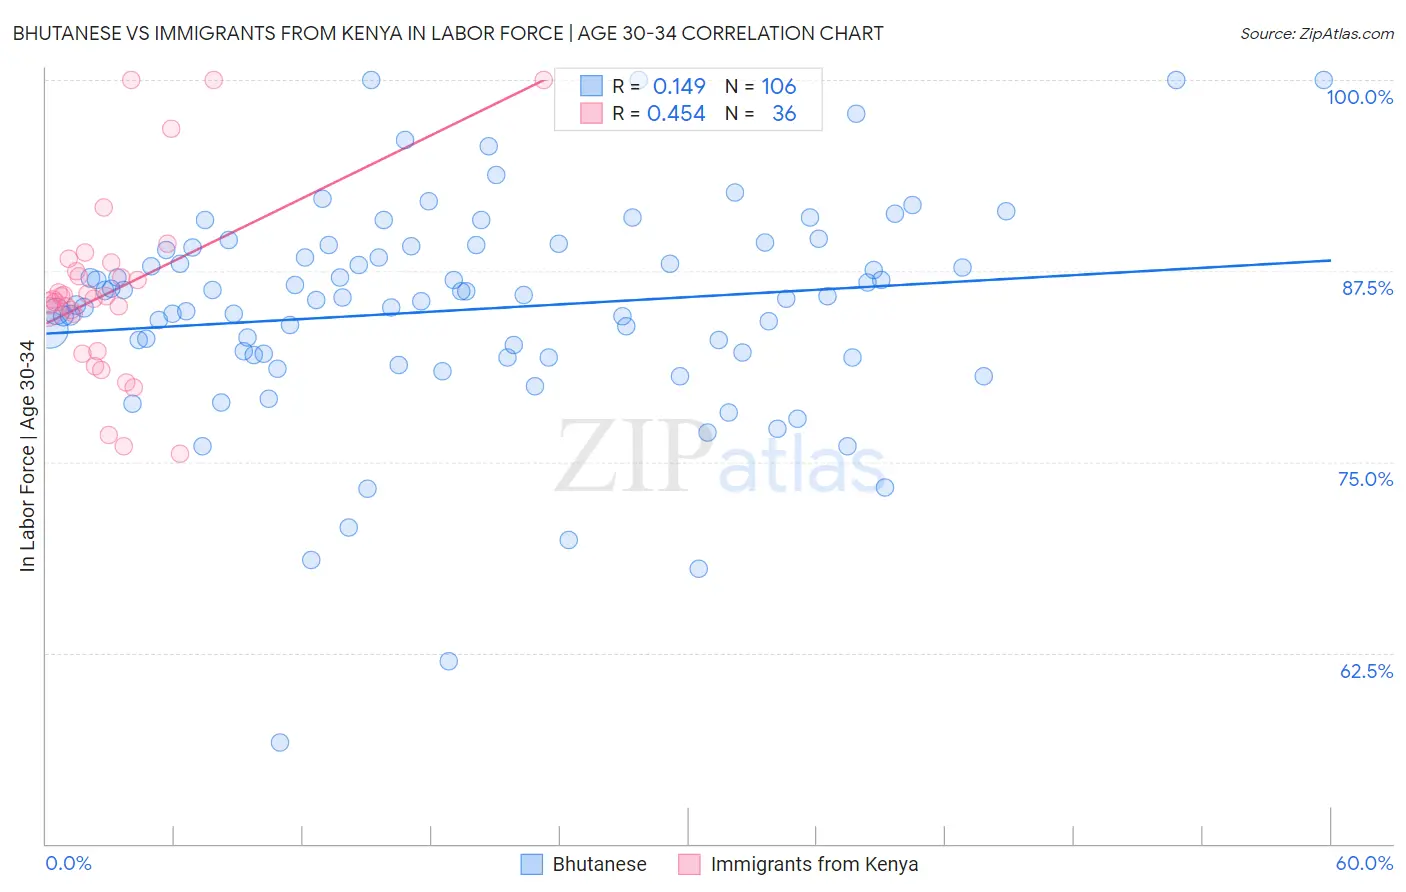
Bhutanese vs Immigrants from Kenya In Labor Force | Age 30-34 Correlation Chart
The statistical analysis conducted on geographies consisting of 455,199,053 people shows a poor positive correlation between the proportion of Bhutanese and labor force participation rate among population between the ages 30 and 34 in the United States with a correlation coefficient (R) of 0.149 and weighted average of 85.0%. Similarly, the statistical analysis conducted on geographies consisting of 217,993,590 people shows a moderate positive correlation between the proportion of Immigrants from Kenya and labor force participation rate among population between the ages 30 and 34 in the United States with a correlation coefficient (R) of 0.454 and weighted average of 85.5%, a difference of 0.63%.
In Labor Force | Age 30-34 Correlation Summary
| Measurement | Bhutanese | Immigrants from Kenya |
| Minimum | 56.7% | 75.5% |
| Maximum | 100.0% | 100.0% |
| Range | 43.3% | 24.5% |
| Mean | 85.0% | 86.2% |
| Median | 85.7% | 85.8% |
| Interquartile 25% (IQ1) | 82.0% | 83.5% |
| Interquartile 75% (IQ3) | 89.0% | 87.7% |
| Interquartile Range (IQR) | 7.0% | 4.3% |
| Standard Deviation (Sample) | 7.2% | 5.9% |
| Standard Deviation (Population) | 7.1% | 5.8% |
Similar Demographics by In Labor Force | Age 30-34
Demographics Similar to Bhutanese by In Labor Force | Age 30-34
In terms of in labor force | age 30-34, the demographic groups most similar to Bhutanese are South African (85.0%, a difference of 0.010%), Sri Lankan (85.0%, a difference of 0.010%), Immigrants from Asia (85.0%, a difference of 0.020%), Jordanian (85.0%, a difference of 0.020%), and Immigrants from Vietnam (85.0%, a difference of 0.020%).
| Demographics | Rating | Rank | In Labor Force | Age 30-34 |
| Immigrants | Israel | 89.5 /100 | #132 | Excellent 85.0% |
| New Zealanders | 89.5 /100 | #133 | Excellent 85.0% |
| Immigrants | Chile | 89.2 /100 | #134 | Excellent 85.0% |
| Immigrants | Asia | 88.9 /100 | #135 | Excellent 85.0% |
| Jordanians | 88.6 /100 | #136 | Excellent 85.0% |
| South Africans | 88.0 /100 | #137 | Excellent 85.0% |
| Sri Lankans | 87.8 /100 | #138 | Excellent 85.0% |
| Bhutanese | 87.5 /100 | #139 | Excellent 85.0% |
| Immigrants | Vietnam | 86.5 /100 | #140 | Excellent 85.0% |
| Chileans | 85.3 /100 | #141 | Excellent 84.9% |
| Immigrants | Indonesia | 84.3 /100 | #142 | Excellent 84.9% |
| Colombians | 82.2 /100 | #143 | Excellent 84.9% |
| Uruguayans | 78.5 /100 | #144 | Good 84.9% |
| Palestinians | 77.7 /100 | #145 | Good 84.9% |
| Immigrants | Saudi Arabia | 76.6 /100 | #146 | Good 84.9% |
Demographics Similar to Immigrants from Kenya by In Labor Force | Age 30-34
In terms of in labor force | age 30-34, the demographic groups most similar to Immigrants from Kenya are Immigrants from Turkey (85.5%, a difference of 0.0%), Filipino (85.5%, a difference of 0.010%), Czech (85.5%, a difference of 0.010%), Russian (85.5%, a difference of 0.010%), and Polish (85.5%, a difference of 0.020%).
| Demographics | Rating | Rank | In Labor Force | Age 30-34 |
| Croatians | 99.8 /100 | #47 | Exceptional 85.6% |
| Immigrants | Sweden | 99.8 /100 | #48 | Exceptional 85.6% |
| Lithuanians | 99.8 /100 | #49 | Exceptional 85.6% |
| Immigrants | Australia | 99.8 /100 | #50 | Exceptional 85.6% |
| Cape Verdeans | 99.7 /100 | #51 | Exceptional 85.6% |
| Slovenes | 99.7 /100 | #52 | Exceptional 85.6% |
| Filipinos | 99.6 /100 | #53 | Exceptional 85.5% |
| Immigrants | Kenya | 99.6 /100 | #54 | Exceptional 85.5% |
| Immigrants | Turkey | 99.6 /100 | #55 | Exceptional 85.5% |
| Czechs | 99.6 /100 | #56 | Exceptional 85.5% |
| Russians | 99.6 /100 | #57 | Exceptional 85.5% |
| Poles | 99.6 /100 | #58 | Exceptional 85.5% |
| Immigrants | Poland | 99.5 /100 | #59 | Exceptional 85.5% |
| Immigrants | France | 99.5 /100 | #60 | Exceptional 85.5% |
| Immigrants | Brazil | 99.5 /100 | #61 | Exceptional 85.5% |