Honduran vs Scandinavian In Labor Force | Age 30-34
COMPARE
Honduran
Scandinavian
In Labor Force | Age 30-34
In Labor Force | Age 30-34 Comparison
Hondurans
Scandinavians
83.8%
IN LABOR FORCE | AGE 30-34
0.3/ 100
METRIC RATING
258th/ 347
METRIC RANK
84.5%
IN LABOR FORCE | AGE 30-34
24.7/ 100
METRIC RATING
192nd/ 347
METRIC RANK
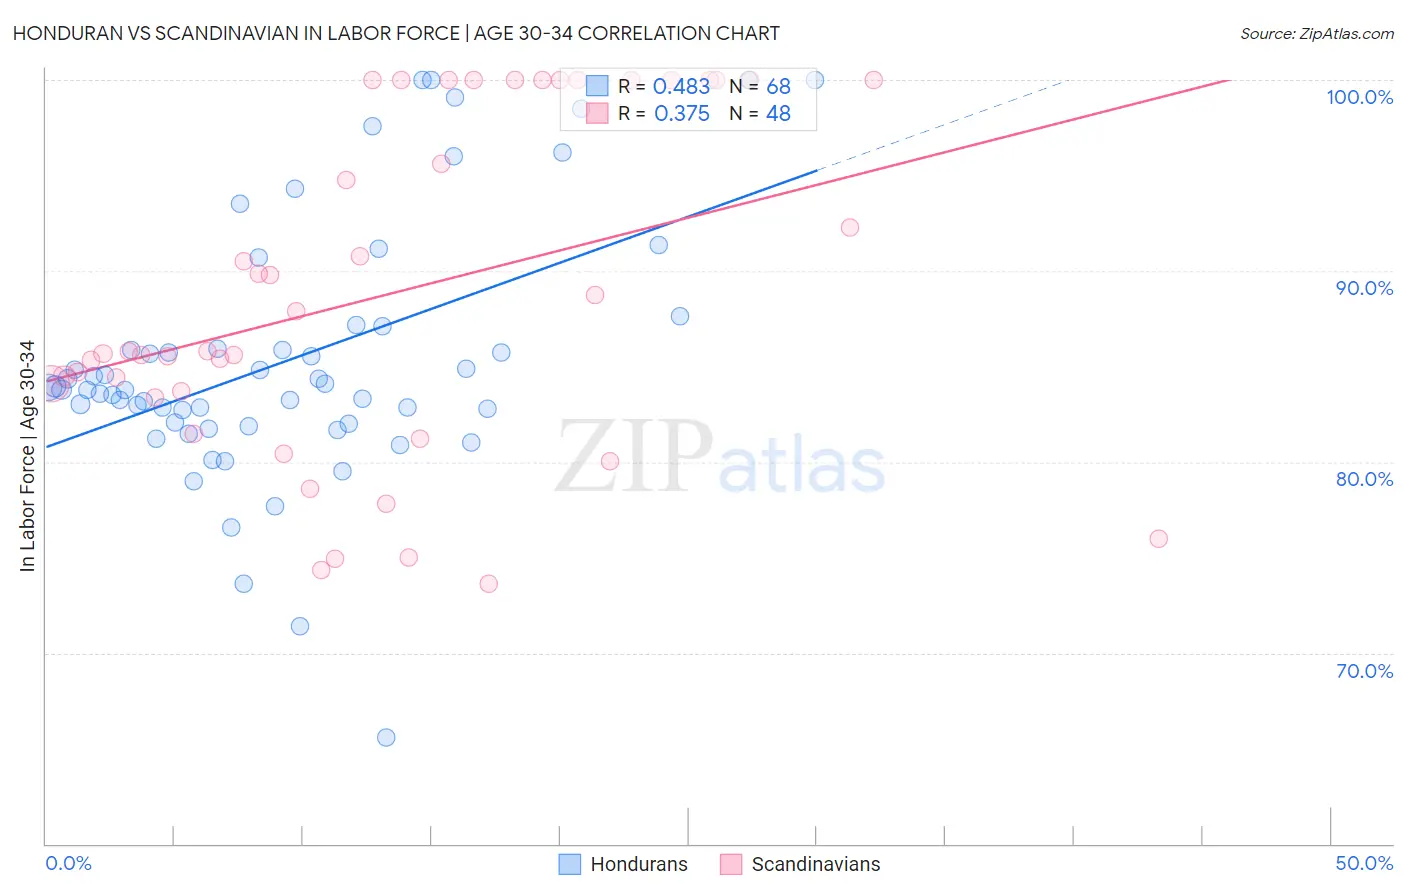
Honduran vs Scandinavian In Labor Force | Age 30-34 Correlation Chart
The statistical analysis conducted on geographies consisting of 357,599,463 people shows a moderate positive correlation between the proportion of Hondurans and labor force participation rate among population between the ages 30 and 34 in the United States with a correlation coefficient (R) of 0.483 and weighted average of 83.8%. Similarly, the statistical analysis conducted on geographies consisting of 472,088,741 people shows a mild positive correlation between the proportion of Scandinavians and labor force participation rate among population between the ages 30 and 34 in the United States with a correlation coefficient (R) of 0.375 and weighted average of 84.5%, a difference of 0.84%.
In Labor Force | Age 30-34 Correlation Summary
| Measurement | Honduran | Scandinavian |
| Minimum | 65.6% | 73.6% |
| Maximum | 100.0% | 100.0% |
| Range | 34.4% | 26.4% |
| Mean | 85.3% | 88.8% |
| Median | 83.8% | 85.8% |
| Interquartile 25% (IQ1) | 82.0% | 83.5% |
| Interquartile 75% (IQ3) | 86.5% | 100.0% |
| Interquartile Range (IQR) | 4.5% | 16.5% |
| Standard Deviation (Sample) | 6.8% | 8.7% |
| Standard Deviation (Population) | 6.7% | 8.6% |
Similar Demographics by In Labor Force | Age 30-34
Demographics Similar to Hondurans by In Labor Force | Age 30-34
In terms of in labor force | age 30-34, the demographic groups most similar to Hondurans are Scotch-Irish (83.8%, a difference of 0.0%), Immigrants from Dominican Republic (83.8%, a difference of 0.020%), Iraqi (83.8%, a difference of 0.030%), Guyanese (83.8%, a difference of 0.030%), and Immigrants from Lebanon (83.9%, a difference of 0.040%).
| Demographics | Rating | Rank | In Labor Force | Age 30-34 |
| Nicaraguans | 0.6 /100 | #251 | Tragic 83.9% |
| Bahamians | 0.6 /100 | #252 | Tragic 83.9% |
| Immigrants | Nicaragua | 0.6 /100 | #253 | Tragic 83.9% |
| Immigrants | St. Vincent and the Grenadines | 0.5 /100 | #254 | Tragic 83.9% |
| Whites/Caucasians | 0.5 /100 | #255 | Tragic 83.9% |
| Immigrants | Lebanon | 0.4 /100 | #256 | Tragic 83.9% |
| Iraqis | 0.3 /100 | #257 | Tragic 83.8% |
| Hondurans | 0.3 /100 | #258 | Tragic 83.8% |
| Scotch-Irish | 0.3 /100 | #259 | Tragic 83.8% |
| Immigrants | Dominican Republic | 0.3 /100 | #260 | Tragic 83.8% |
| Guyanese | 0.3 /100 | #261 | Tragic 83.8% |
| Dominicans | 0.2 /100 | #262 | Tragic 83.8% |
| Immigrants | Guyana | 0.2 /100 | #263 | Tragic 83.8% |
| Guatemalans | 0.2 /100 | #264 | Tragic 83.7% |
| Immigrants | Honduras | 0.1 /100 | #265 | Tragic 83.7% |
Demographics Similar to Scandinavians by In Labor Force | Age 30-34
In terms of in labor force | age 30-34, the demographic groups most similar to Scandinavians are Hungarian (84.5%, a difference of 0.0%), Immigrants from Zaire (84.5%, a difference of 0.010%), Immigrants from Costa Rica (84.5%, a difference of 0.010%), Immigrants from Afghanistan (84.5%, a difference of 0.010%), and Korean (84.5%, a difference of 0.010%).
| Demographics | Rating | Rank | In Labor Force | Age 30-34 |
| Immigrants | Philippines | 31.5 /100 | #185 | Fair 84.6% |
| Immigrants | Congo | 29.7 /100 | #186 | Fair 84.6% |
| Costa Ricans | 29.6 /100 | #187 | Fair 84.6% |
| Taiwanese | 29.4 /100 | #188 | Fair 84.6% |
| Nigerians | 28.9 /100 | #189 | Fair 84.5% |
| Immigrants | Zaire | 25.8 /100 | #190 | Fair 84.5% |
| Hungarians | 24.8 /100 | #191 | Fair 84.5% |
| Scandinavians | 24.7 /100 | #192 | Fair 84.5% |
| Immigrants | Costa Rica | 23.9 /100 | #193 | Fair 84.5% |
| Immigrants | Afghanistan | 23.5 /100 | #194 | Fair 84.5% |
| Koreans | 23.2 /100 | #195 | Fair 84.5% |
| British | 22.9 /100 | #196 | Fair 84.5% |
| Immigrants | Syria | 21.9 /100 | #197 | Fair 84.5% |
| Dutch | 20.2 /100 | #198 | Fair 84.5% |
| Immigrants | Thailand | 19.1 /100 | #199 | Poor 84.5% |