Immigrants from Lithuania vs Immigrants from Kenya In Labor Force | Age 30-34
COMPARE
Immigrants from Lithuania
Immigrants from Kenya
In Labor Force | Age 30-34
In Labor Force | Age 30-34 Comparison
Immigrants from Lithuania
Immigrants from Kenya
85.6%
IN LABOR FORCE | AGE 30-34
99.8/ 100
METRIC RATING
43rd/ 347
METRIC RANK
85.5%
IN LABOR FORCE | AGE 30-34
99.6/ 100
METRIC RATING
54th/ 347
METRIC RANK
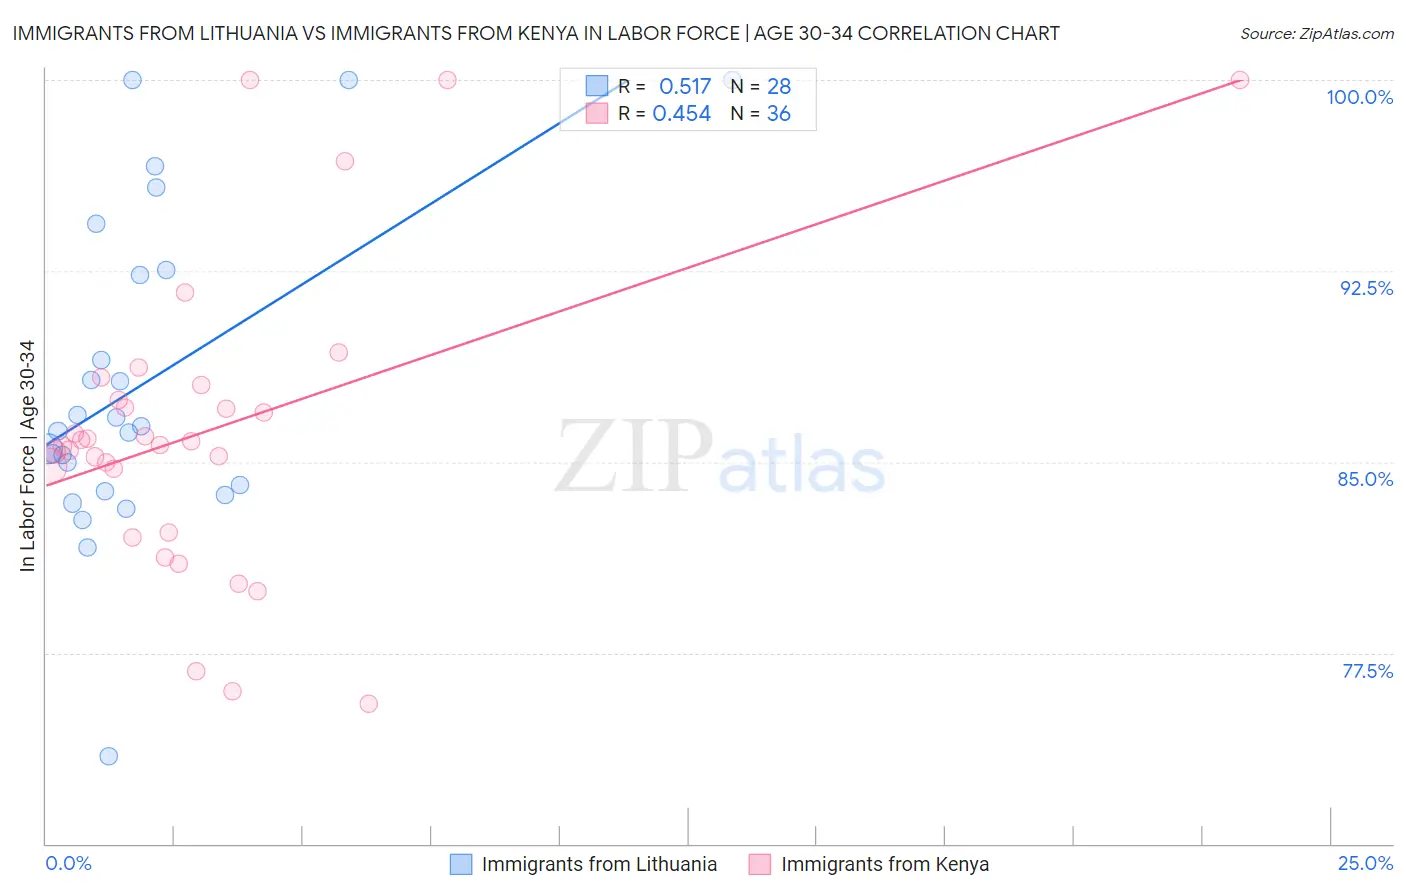
Immigrants from Lithuania vs Immigrants from Kenya In Labor Force | Age 30-34 Correlation Chart
The statistical analysis conducted on geographies consisting of 117,688,964 people shows a substantial positive correlation between the proportion of Immigrants from Lithuania and labor force participation rate among population between the ages 30 and 34 in the United States with a correlation coefficient (R) of 0.517 and weighted average of 85.6%. Similarly, the statistical analysis conducted on geographies consisting of 217,993,590 people shows a moderate positive correlation between the proportion of Immigrants from Kenya and labor force participation rate among population between the ages 30 and 34 in the United States with a correlation coefficient (R) of 0.454 and weighted average of 85.5%, a difference of 0.16%.
In Labor Force | Age 30-34 Correlation Summary
| Measurement | Immigrants from Lithuania | Immigrants from Kenya |
| Minimum | 73.4% | 75.5% |
| Maximum | 100.0% | 100.0% |
| Range | 26.6% | 24.5% |
| Mean | 88.1% | 86.2% |
| Median | 86.3% | 85.8% |
| Interquartile 25% (IQ1) | 84.0% | 83.5% |
| Interquartile 75% (IQ3) | 92.4% | 87.7% |
| Interquartile Range (IQR) | 8.5% | 4.3% |
| Standard Deviation (Sample) | 6.3% | 5.9% |
| Standard Deviation (Population) | 6.2% | 5.8% |
Demographics Similar to Immigrants from Lithuania and Immigrants from Kenya by In Labor Force | Age 30-34
In terms of in labor force | age 30-34, the demographic groups most similar to Immigrants from Lithuania are Zimbabwean (85.6%, a difference of 0.0%), Immigrants from Italy (85.7%, a difference of 0.010%), Immigrants from Sri Lanka (85.6%, a difference of 0.030%), Immigrants from Nepal (85.6%, a difference of 0.030%), and Turkish (85.7%, a difference of 0.040%). Similarly, the demographic groups most similar to Immigrants from Kenya are Immigrants from Turkey (85.5%, a difference of 0.0%), Filipino (85.5%, a difference of 0.010%), Czech (85.5%, a difference of 0.010%), Russian (85.5%, a difference of 0.010%), and Polish (85.5%, a difference of 0.020%).
| Demographics | Rating | Rank | In Labor Force | Age 30-34 |
| Immigrants | Greece | 99.9 /100 | #38 | Exceptional 85.7% |
| Eastern Europeans | 99.9 /100 | #39 | Exceptional 85.7% |
| Turks | 99.9 /100 | #40 | Exceptional 85.7% |
| Immigrants | Italy | 99.9 /100 | #41 | Exceptional 85.7% |
| Zimbabweans | 99.8 /100 | #42 | Exceptional 85.6% |
| Immigrants | Lithuania | 99.8 /100 | #43 | Exceptional 85.6% |
| Immigrants | Sri Lanka | 99.8 /100 | #44 | Exceptional 85.6% |
| Immigrants | Nepal | 99.8 /100 | #45 | Exceptional 85.6% |
| Immigrants | Morocco | 99.8 /100 | #46 | Exceptional 85.6% |
| Croatians | 99.8 /100 | #47 | Exceptional 85.6% |
| Immigrants | Sweden | 99.8 /100 | #48 | Exceptional 85.6% |
| Lithuanians | 99.8 /100 | #49 | Exceptional 85.6% |
| Immigrants | Australia | 99.8 /100 | #50 | Exceptional 85.6% |
| Cape Verdeans | 99.7 /100 | #51 | Exceptional 85.6% |
| Slovenes | 99.7 /100 | #52 | Exceptional 85.6% |
| Filipinos | 99.6 /100 | #53 | Exceptional 85.5% |
| Immigrants | Kenya | 99.6 /100 | #54 | Exceptional 85.5% |
| Immigrants | Turkey | 99.6 /100 | #55 | Exceptional 85.5% |
| Czechs | 99.6 /100 | #56 | Exceptional 85.5% |
| Russians | 99.6 /100 | #57 | Exceptional 85.5% |
| Poles | 99.6 /100 | #58 | Exceptional 85.5% |