U.S. Virgin Islander vs Immigrants from Kenya In Labor Force | Age 30-34
COMPARE
U.S. Virgin Islander
Immigrants from Kenya
In Labor Force | Age 30-34
In Labor Force | Age 30-34 Comparison
U.S. Virgin Islanders
Immigrants from Kenya
84.1%
IN LABOR FORCE | AGE 30-34
1.5/ 100
METRIC RATING
236th/ 347
METRIC RANK
85.5%
IN LABOR FORCE | AGE 30-34
99.6/ 100
METRIC RATING
54th/ 347
METRIC RANK
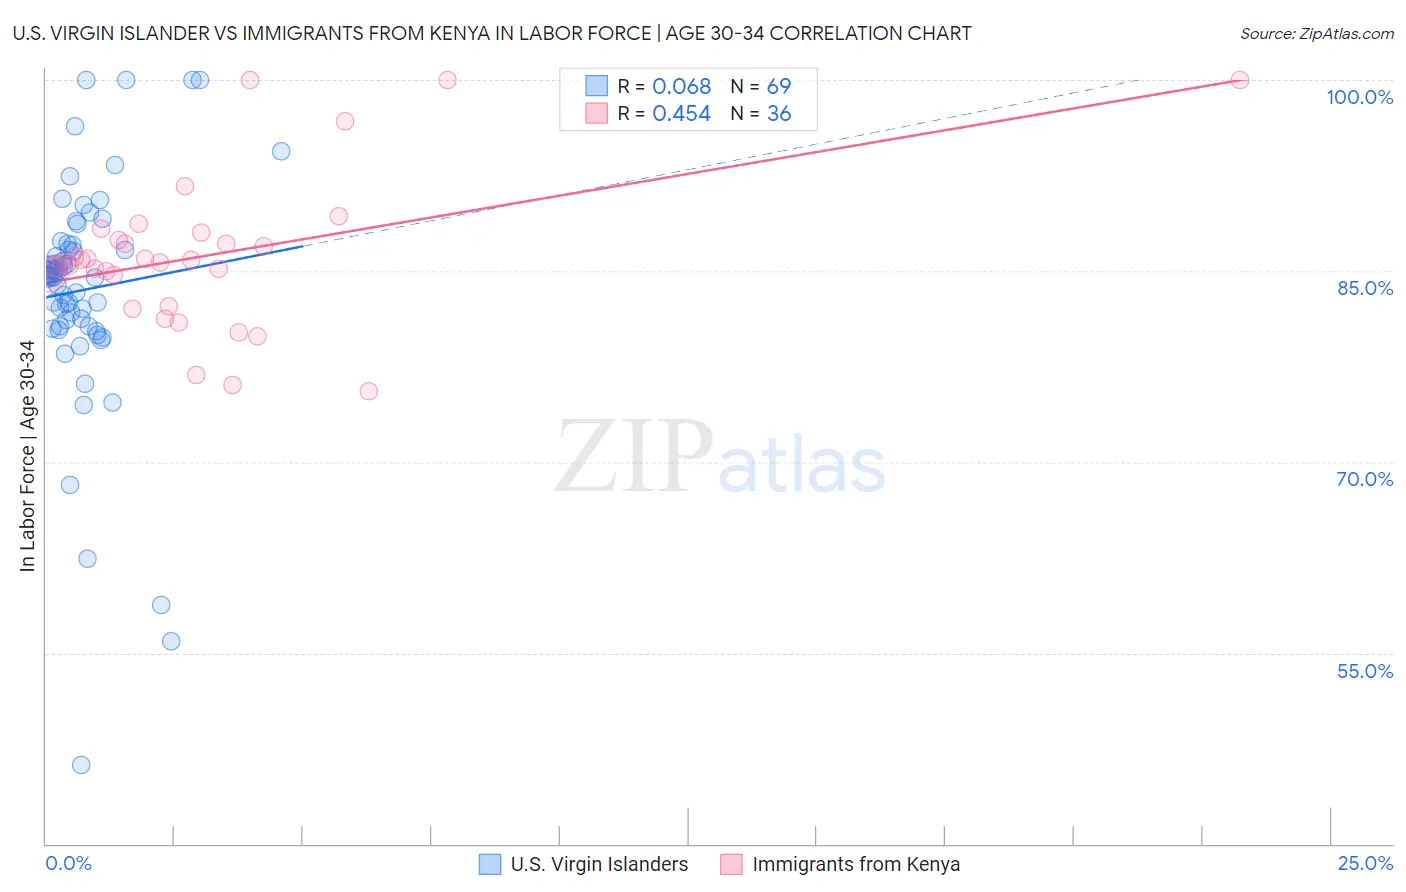
U.S. Virgin Islander vs Immigrants from Kenya In Labor Force | Age 30-34 Correlation Chart
The statistical analysis conducted on geographies consisting of 87,504,880 people shows a slight positive correlation between the proportion of U.S. Virgin Islanders and labor force participation rate among population between the ages 30 and 34 in the United States with a correlation coefficient (R) of 0.068 and weighted average of 84.1%. Similarly, the statistical analysis conducted on geographies consisting of 217,993,590 people shows a moderate positive correlation between the proportion of Immigrants from Kenya and labor force participation rate among population between the ages 30 and 34 in the United States with a correlation coefficient (R) of 0.454 and weighted average of 85.5%, a difference of 1.7%.
In Labor Force | Age 30-34 Correlation Summary
| Measurement | U.S. Virgin Islander | Immigrants from Kenya |
| Minimum | 46.2% | 75.5% |
| Maximum | 100.0% | 100.0% |
| Range | 53.8% | 24.5% |
| Mean | 83.5% | 86.2% |
| Median | 84.6% | 85.8% |
| Interquartile 25% (IQ1) | 80.6% | 83.5% |
| Interquartile 75% (IQ3) | 87.1% | 87.7% |
| Interquartile Range (IQR) | 6.5% | 4.3% |
| Standard Deviation (Sample) | 9.2% | 5.9% |
| Standard Deviation (Population) | 9.1% | 5.8% |
Similar Demographics by In Labor Force | Age 30-34
Demographics Similar to U.S. Virgin Islanders by In Labor Force | Age 30-34
In terms of in labor force | age 30-34, the demographic groups most similar to U.S. Virgin Islanders are Celtic (84.1%, a difference of 0.010%), French American Indian (84.1%, a difference of 0.020%), Immigrants from Barbados (84.0%, a difference of 0.020%), English (84.0%, a difference of 0.020%), and Venezuelan (84.0%, a difference of 0.020%).
| Demographics | Rating | Rank | In Labor Force | Age 30-34 |
| Welsh | 2.7 /100 | #229 | Tragic 84.2% |
| Immigrants | Bahamas | 2.6 /100 | #230 | Tragic 84.1% |
| Malaysians | 2.2 /100 | #231 | Tragic 84.1% |
| Immigrants | Immigrants | 2.0 /100 | #232 | Tragic 84.1% |
| West Indians | 1.9 /100 | #233 | Tragic 84.1% |
| Haitians | 1.8 /100 | #234 | Tragic 84.1% |
| French American Indians | 1.7 /100 | #235 | Tragic 84.1% |
| U.S. Virgin Islanders | 1.5 /100 | #236 | Tragic 84.1% |
| Celtics | 1.4 /100 | #237 | Tragic 84.1% |
| Immigrants | Barbados | 1.4 /100 | #238 | Tragic 84.0% |
| English | 1.4 /100 | #239 | Tragic 84.0% |
| Venezuelans | 1.3 /100 | #240 | Tragic 84.0% |
| Immigrants | Portugal | 1.2 /100 | #241 | Tragic 84.0% |
| Immigrants | Oceania | 1.1 /100 | #242 | Tragic 84.0% |
| Immigrants | Caribbean | 1.1 /100 | #243 | Tragic 84.0% |
Demographics Similar to Immigrants from Kenya by In Labor Force | Age 30-34
In terms of in labor force | age 30-34, the demographic groups most similar to Immigrants from Kenya are Immigrants from Turkey (85.5%, a difference of 0.0%), Filipino (85.5%, a difference of 0.010%), Czech (85.5%, a difference of 0.010%), Russian (85.5%, a difference of 0.010%), and Polish (85.5%, a difference of 0.020%).
| Demographics | Rating | Rank | In Labor Force | Age 30-34 |
| Croatians | 99.8 /100 | #47 | Exceptional 85.6% |
| Immigrants | Sweden | 99.8 /100 | #48 | Exceptional 85.6% |
| Lithuanians | 99.8 /100 | #49 | Exceptional 85.6% |
| Immigrants | Australia | 99.8 /100 | #50 | Exceptional 85.6% |
| Cape Verdeans | 99.7 /100 | #51 | Exceptional 85.6% |
| Slovenes | 99.7 /100 | #52 | Exceptional 85.6% |
| Filipinos | 99.6 /100 | #53 | Exceptional 85.5% |
| Immigrants | Kenya | 99.6 /100 | #54 | Exceptional 85.5% |
| Immigrants | Turkey | 99.6 /100 | #55 | Exceptional 85.5% |
| Czechs | 99.6 /100 | #56 | Exceptional 85.5% |
| Russians | 99.6 /100 | #57 | Exceptional 85.5% |
| Poles | 99.6 /100 | #58 | Exceptional 85.5% |
| Immigrants | Poland | 99.5 /100 | #59 | Exceptional 85.5% |
| Immigrants | France | 99.5 /100 | #60 | Exceptional 85.5% |
| Immigrants | Brazil | 99.5 /100 | #61 | Exceptional 85.5% |