Honduran vs Dutch West Indian In Labor Force | Age 30-34
COMPARE
Honduran
Dutch West Indian
In Labor Force | Age 30-34
In Labor Force | Age 30-34 Comparison
Hondurans
Dutch West Indians
83.8%
IN LABOR FORCE | AGE 30-34
0.3/ 100
METRIC RATING
258th/ 347
METRIC RANK
81.0%
IN LABOR FORCE | AGE 30-34
0.0/ 100
METRIC RATING
325th/ 347
METRIC RANK
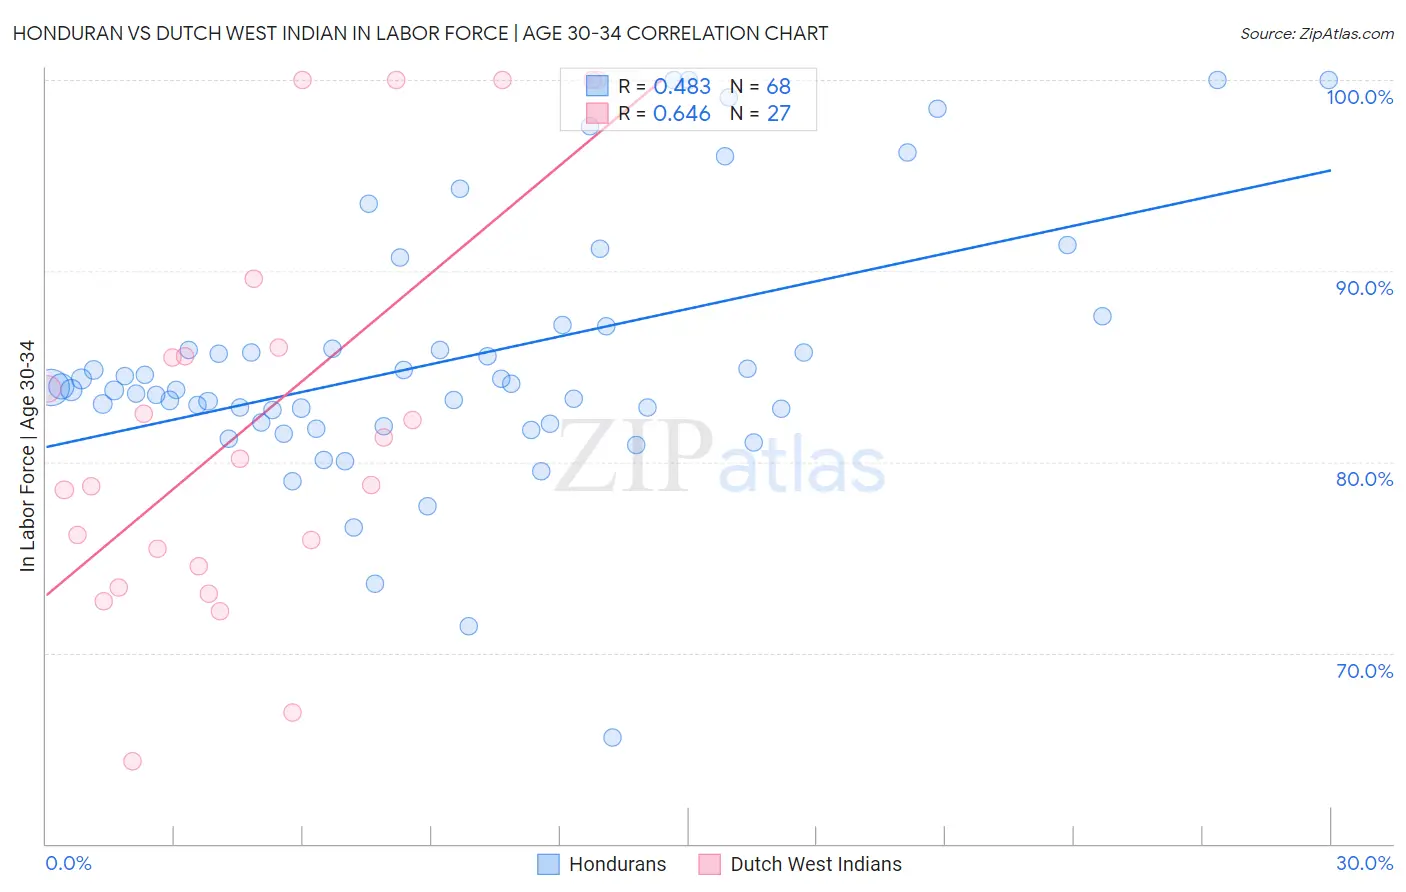
Honduran vs Dutch West Indian In Labor Force | Age 30-34 Correlation Chart
The statistical analysis conducted on geographies consisting of 357,599,463 people shows a moderate positive correlation between the proportion of Hondurans and labor force participation rate among population between the ages 30 and 34 in the United States with a correlation coefficient (R) of 0.483 and weighted average of 83.8%. Similarly, the statistical analysis conducted on geographies consisting of 85,757,980 people shows a significant positive correlation between the proportion of Dutch West Indians and labor force participation rate among population between the ages 30 and 34 in the United States with a correlation coefficient (R) of 0.646 and weighted average of 81.0%, a difference of 3.4%.
In Labor Force | Age 30-34 Correlation Summary
| Measurement | Honduran | Dutch West Indian |
| Minimum | 65.6% | 64.3% |
| Maximum | 100.0% | 100.0% |
| Range | 34.4% | 35.7% |
| Mean | 85.3% | 82.1% |
| Median | 83.8% | 80.2% |
| Interquartile 25% (IQ1) | 82.0% | 74.5% |
| Interquartile 75% (IQ3) | 86.5% | 86.0% |
| Interquartile Range (IQR) | 4.5% | 11.4% |
| Standard Deviation (Sample) | 6.8% | 10.4% |
| Standard Deviation (Population) | 6.7% | 10.2% |
Similar Demographics by In Labor Force | Age 30-34
Demographics Similar to Hondurans by In Labor Force | Age 30-34
In terms of in labor force | age 30-34, the demographic groups most similar to Hondurans are Scotch-Irish (83.8%, a difference of 0.0%), Immigrants from Dominican Republic (83.8%, a difference of 0.020%), Iraqi (83.8%, a difference of 0.030%), Guyanese (83.8%, a difference of 0.030%), and Immigrants from Lebanon (83.9%, a difference of 0.040%).
| Demographics | Rating | Rank | In Labor Force | Age 30-34 |
| Nicaraguans | 0.6 /100 | #251 | Tragic 83.9% |
| Bahamians | 0.6 /100 | #252 | Tragic 83.9% |
| Immigrants | Nicaragua | 0.6 /100 | #253 | Tragic 83.9% |
| Immigrants | St. Vincent and the Grenadines | 0.5 /100 | #254 | Tragic 83.9% |
| Whites/Caucasians | 0.5 /100 | #255 | Tragic 83.9% |
| Immigrants | Lebanon | 0.4 /100 | #256 | Tragic 83.9% |
| Iraqis | 0.3 /100 | #257 | Tragic 83.8% |
| Hondurans | 0.3 /100 | #258 | Tragic 83.8% |
| Scotch-Irish | 0.3 /100 | #259 | Tragic 83.8% |
| Immigrants | Dominican Republic | 0.3 /100 | #260 | Tragic 83.8% |
| Guyanese | 0.3 /100 | #261 | Tragic 83.8% |
| Dominicans | 0.2 /100 | #262 | Tragic 83.8% |
| Immigrants | Guyana | 0.2 /100 | #263 | Tragic 83.8% |
| Guatemalans | 0.2 /100 | #264 | Tragic 83.7% |
| Immigrants | Honduras | 0.1 /100 | #265 | Tragic 83.7% |
Demographics Similar to Dutch West Indians by In Labor Force | Age 30-34
In terms of in labor force | age 30-34, the demographic groups most similar to Dutch West Indians are Cheyenne (81.1%, a difference of 0.15%), Paiute (81.2%, a difference of 0.19%), Seminole (80.8%, a difference of 0.22%), Puerto Rican (81.2%, a difference of 0.23%), and Alaska Native (81.3%, a difference of 0.39%).
| Demographics | Rating | Rank | In Labor Force | Age 30-34 |
| Choctaw | 0.0 /100 | #318 | Tragic 81.4% |
| Shoshone | 0.0 /100 | #319 | Tragic 81.4% |
| Yaqui | 0.0 /100 | #320 | Tragic 81.4% |
| Alaska Natives | 0.0 /100 | #321 | Tragic 81.3% |
| Puerto Ricans | 0.0 /100 | #322 | Tragic 81.2% |
| Paiute | 0.0 /100 | #323 | Tragic 81.2% |
| Cheyenne | 0.0 /100 | #324 | Tragic 81.1% |
| Dutch West Indians | 0.0 /100 | #325 | Tragic 81.0% |
| Seminole | 0.0 /100 | #326 | Tragic 80.8% |
| Colville | 0.0 /100 | #327 | Tragic 80.7% |
| Sioux | 0.0 /100 | #328 | Tragic 80.4% |
| Creek | 0.0 /100 | #329 | Tragic 80.4% |
| Pueblo | 0.0 /100 | #330 | Tragic 80.0% |
| Houma | 0.0 /100 | #331 | Tragic 79.9% |
| Kiowa | 0.0 /100 | #332 | Tragic 79.8% |