Creek vs Basque In Labor Force | Age 35-44
COMPARE
Creek
Basque
In Labor Force | Age 35-44
In Labor Force | Age 35-44 Comparison
Creek
Basques
80.0%
IN LABOR FORCE | AGE 35-44
0.0/ 100
METRIC RATING
328th/ 347
METRIC RANK
83.6%
IN LABOR FORCE | AGE 35-44
0.3/ 100
METRIC RATING
257th/ 347
METRIC RANK
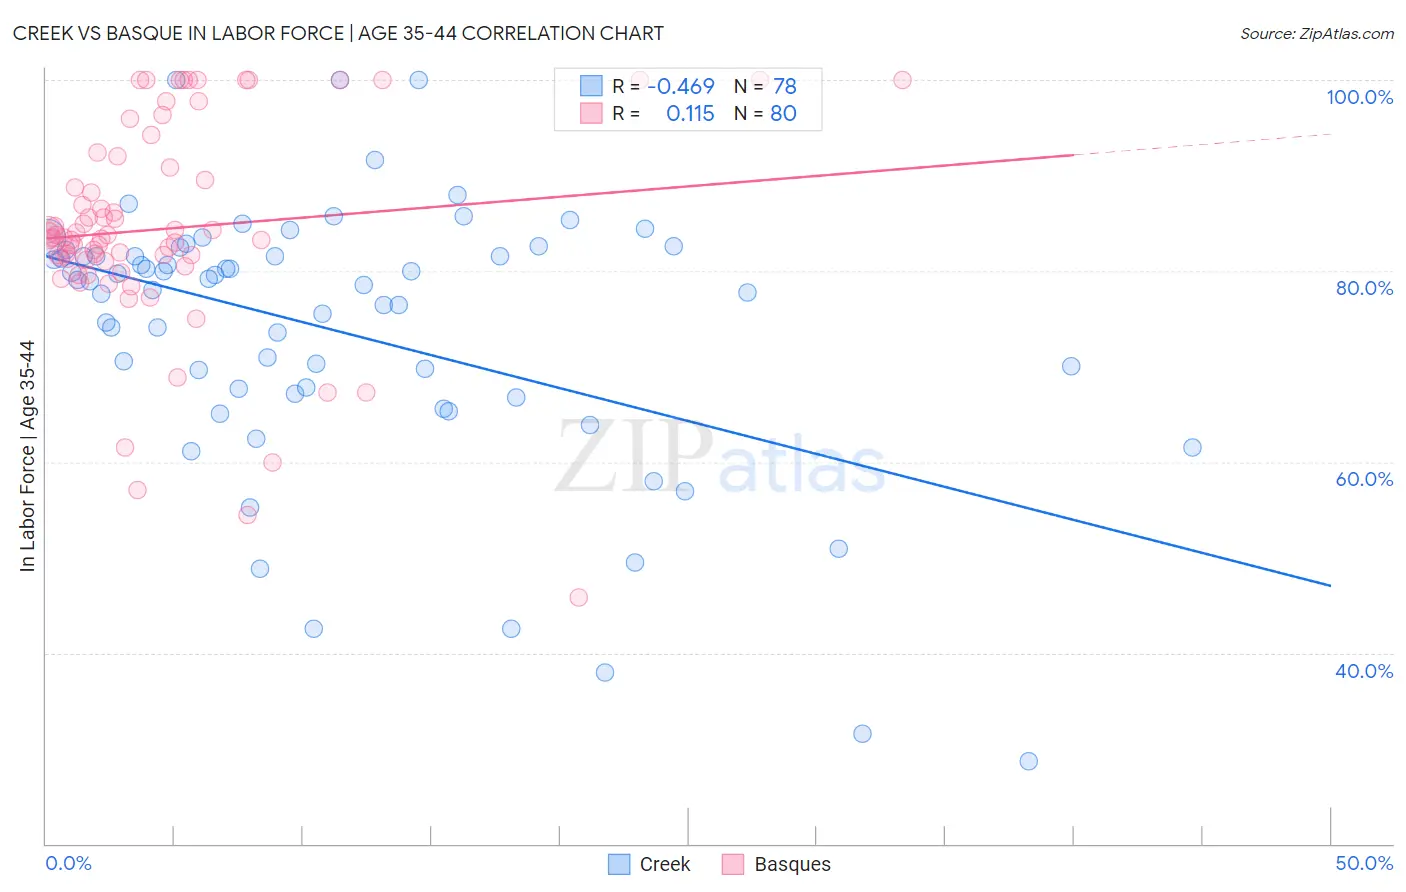
Creek vs Basque In Labor Force | Age 35-44 Correlation Chart
The statistical analysis conducted on geographies consisting of 178,449,180 people shows a moderate negative correlation between the proportion of Creek and labor force participation rate among population between the ages 35 and 44 in the United States with a correlation coefficient (R) of -0.469 and weighted average of 80.0%. Similarly, the statistical analysis conducted on geographies consisting of 165,759,018 people shows a poor positive correlation between the proportion of Basques and labor force participation rate among population between the ages 35 and 44 in the United States with a correlation coefficient (R) of 0.115 and weighted average of 83.6%, a difference of 4.4%.
In Labor Force | Age 35-44 Correlation Summary
| Measurement | Creek | Basque |
| Minimum | 28.7% | 45.8% |
| Maximum | 100.0% | 100.0% |
| Range | 71.3% | 54.2% |
| Mean | 73.6% | 84.4% |
| Median | 78.7% | 83.5% |
| Interquartile 25% (IQ1) | 67.2% | 81.1% |
| Interquartile 75% (IQ3) | 81.6% | 91.4% |
| Interquartile Range (IQR) | 14.4% | 10.3% |
| Standard Deviation (Sample) | 14.3% | 11.1% |
| Standard Deviation (Population) | 14.2% | 11.0% |
Similar Demographics by In Labor Force | Age 35-44
Demographics Similar to Creek by In Labor Force | Age 35-44
In terms of in labor force | age 35-44, the demographic groups most similar to Creek are Sioux (80.2%, a difference of 0.29%), Menominee (79.7%, a difference of 0.44%), Seminole (80.4%, a difference of 0.46%), Dutch West Indian (80.4%, a difference of 0.50%), and Cheyenne (79.5%, a difference of 0.64%).
| Demographics | Rating | Rank | In Labor Force | Age 35-44 |
| Puerto Ricans | 0.0 /100 | #321 | Tragic 80.7% |
| Paiute | 0.0 /100 | #322 | Tragic 80.6% |
| Yaqui | 0.0 /100 | #323 | Tragic 80.5% |
| Choctaw | 0.0 /100 | #324 | Tragic 80.5% |
| Dutch West Indians | 0.0 /100 | #325 | Tragic 80.4% |
| Seminole | 0.0 /100 | #326 | Tragic 80.4% |
| Sioux | 0.0 /100 | #327 | Tragic 80.2% |
| Creek | 0.0 /100 | #328 | Tragic 80.0% |
| Menominee | 0.0 /100 | #329 | Tragic 79.7% |
| Cheyenne | 0.0 /100 | #330 | Tragic 79.5% |
| Houma | 0.0 /100 | #331 | Tragic 79.5% |
| Ute | 0.0 /100 | #332 | Tragic 79.4% |
| Kiowa | 0.0 /100 | #333 | Tragic 79.2% |
| Yakama | 0.0 /100 | #334 | Tragic 79.0% |
| Natives/Alaskans | 0.0 /100 | #335 | Tragic 78.9% |
Demographics Similar to Basques by In Labor Force | Age 35-44
In terms of in labor force | age 35-44, the demographic groups most similar to Basques are Japanese (83.6%, a difference of 0.020%), Tsimshian (83.5%, a difference of 0.020%), Immigrants from the Azores (83.6%, a difference of 0.030%), Immigrants from El Salvador (83.5%, a difference of 0.050%), and Tongan (83.6%, a difference of 0.060%).
| Demographics | Rating | Rank | In Labor Force | Age 35-44 |
| Whites/Caucasians | 0.5 /100 | #250 | Tragic 83.6% |
| Salvadorans | 0.4 /100 | #251 | Tragic 83.6% |
| Immigrants | Guyana | 0.4 /100 | #252 | Tragic 83.6% |
| Lebanese | 0.4 /100 | #253 | Tragic 83.6% |
| Tongans | 0.4 /100 | #254 | Tragic 83.6% |
| Immigrants | Azores | 0.3 /100 | #255 | Tragic 83.6% |
| Japanese | 0.3 /100 | #256 | Tragic 83.6% |
| Basques | 0.3 /100 | #257 | Tragic 83.6% |
| Tsimshian | 0.2 /100 | #258 | Tragic 83.5% |
| Immigrants | El Salvador | 0.2 /100 | #259 | Tragic 83.5% |
| Vietnamese | 0.2 /100 | #260 | Tragic 83.5% |
| Immigrants | Dominica | 0.2 /100 | #261 | Tragic 83.5% |
| Immigrants | Congo | 0.2 /100 | #262 | Tragic 83.5% |
| Iroquois | 0.2 /100 | #263 | Tragic 83.5% |
| Scotch-Irish | 0.1 /100 | #264 | Tragic 83.5% |