Immigrants from Hong Kong vs Basque In Labor Force | Age 35-44
COMPARE
Immigrants from Hong Kong
Basque
In Labor Force | Age 35-44
In Labor Force | Age 35-44 Comparison
Immigrants from Hong Kong
Basques
85.2%
IN LABOR FORCE | AGE 35-44
99.8/ 100
METRIC RATING
46th/ 347
METRIC RANK
83.6%
IN LABOR FORCE | AGE 35-44
0.3/ 100
METRIC RATING
257th/ 347
METRIC RANK
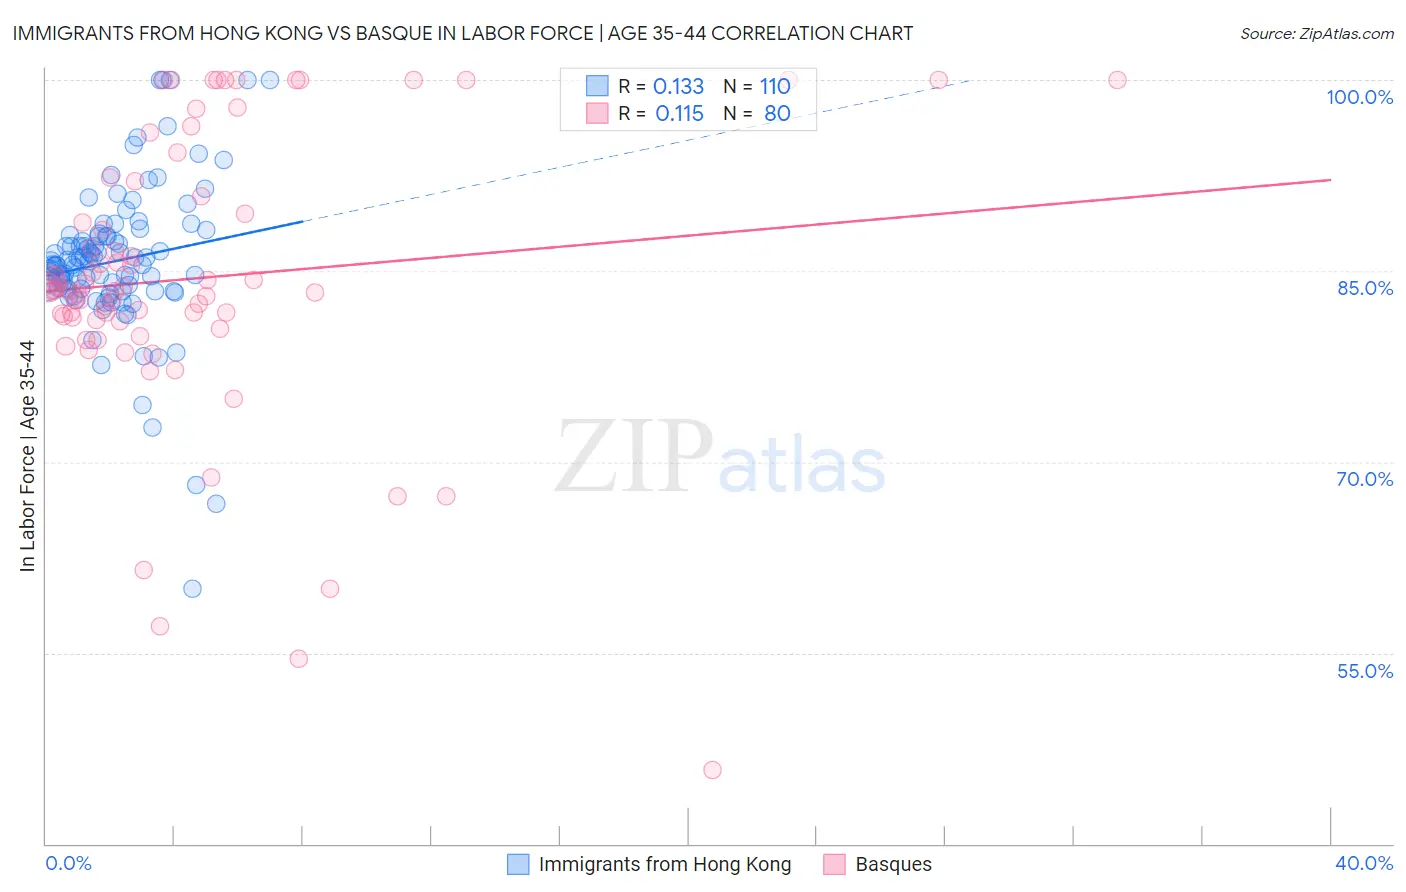
Immigrants from Hong Kong vs Basque In Labor Force | Age 35-44 Correlation Chart
The statistical analysis conducted on geographies consisting of 253,913,732 people shows a poor positive correlation between the proportion of Immigrants from Hong Kong and labor force participation rate among population between the ages 35 and 44 in the United States with a correlation coefficient (R) of 0.133 and weighted average of 85.2%. Similarly, the statistical analysis conducted on geographies consisting of 165,759,018 people shows a poor positive correlation between the proportion of Basques and labor force participation rate among population between the ages 35 and 44 in the United States with a correlation coefficient (R) of 0.115 and weighted average of 83.6%, a difference of 1.9%.
In Labor Force | Age 35-44 Correlation Summary
| Measurement | Immigrants from Hong Kong | Basque |
| Minimum | 60.0% | 45.8% |
| Maximum | 100.0% | 100.0% |
| Range | 40.0% | 54.2% |
| Mean | 85.8% | 84.4% |
| Median | 85.5% | 83.5% |
| Interquartile 25% (IQ1) | 83.6% | 81.1% |
| Interquartile 75% (IQ3) | 87.7% | 91.4% |
| Interquartile Range (IQR) | 4.1% | 10.3% |
| Standard Deviation (Sample) | 6.0% | 11.1% |
| Standard Deviation (Population) | 6.0% | 11.0% |
Similar Demographics by In Labor Force | Age 35-44
Demographics Similar to Immigrants from Hong Kong by In Labor Force | Age 35-44
In terms of in labor force | age 35-44, the demographic groups most similar to Immigrants from Hong Kong are Cypriot (85.2%, a difference of 0.0%), German Russian (85.2%, a difference of 0.010%), Polish (85.2%, a difference of 0.020%), Lithuanian (85.2%, a difference of 0.020%), and Immigrants from Eritrea (85.2%, a difference of 0.020%).
| Demographics | Rating | Rank | In Labor Force | Age 35-44 |
| Eastern Europeans | 99.8 /100 | #39 | Exceptional 85.2% |
| Immigrants | Bulgaria | 99.8 /100 | #40 | Exceptional 85.2% |
| Immigrants | Zimbabwe | 99.8 /100 | #41 | Exceptional 85.2% |
| Macedonians | 99.8 /100 | #42 | Exceptional 85.2% |
| Poles | 99.8 /100 | #43 | Exceptional 85.2% |
| Lithuanians | 99.8 /100 | #44 | Exceptional 85.2% |
| Cypriots | 99.8 /100 | #45 | Exceptional 85.2% |
| Immigrants | Hong Kong | 99.8 /100 | #46 | Exceptional 85.2% |
| German Russians | 99.8 /100 | #47 | Exceptional 85.2% |
| Immigrants | Eritrea | 99.7 /100 | #48 | Exceptional 85.2% |
| Croatians | 99.7 /100 | #49 | Exceptional 85.2% |
| Thais | 99.7 /100 | #50 | Exceptional 85.2% |
| Immigrants | Albania | 99.7 /100 | #51 | Exceptional 85.1% |
| Immigrants | Kenya | 99.6 /100 | #52 | Exceptional 85.1% |
| Taiwanese | 99.6 /100 | #53 | Exceptional 85.1% |
Demographics Similar to Basques by In Labor Force | Age 35-44
In terms of in labor force | age 35-44, the demographic groups most similar to Basques are Japanese (83.6%, a difference of 0.020%), Tsimshian (83.5%, a difference of 0.020%), Immigrants from the Azores (83.6%, a difference of 0.030%), Immigrants from El Salvador (83.5%, a difference of 0.050%), and Tongan (83.6%, a difference of 0.060%).
| Demographics | Rating | Rank | In Labor Force | Age 35-44 |
| Whites/Caucasians | 0.5 /100 | #250 | Tragic 83.6% |
| Salvadorans | 0.4 /100 | #251 | Tragic 83.6% |
| Immigrants | Guyana | 0.4 /100 | #252 | Tragic 83.6% |
| Lebanese | 0.4 /100 | #253 | Tragic 83.6% |
| Tongans | 0.4 /100 | #254 | Tragic 83.6% |
| Immigrants | Azores | 0.3 /100 | #255 | Tragic 83.6% |
| Japanese | 0.3 /100 | #256 | Tragic 83.6% |
| Basques | 0.3 /100 | #257 | Tragic 83.6% |
| Tsimshian | 0.2 /100 | #258 | Tragic 83.5% |
| Immigrants | El Salvador | 0.2 /100 | #259 | Tragic 83.5% |
| Vietnamese | 0.2 /100 | #260 | Tragic 83.5% |
| Immigrants | Dominica | 0.2 /100 | #261 | Tragic 83.5% |
| Immigrants | Congo | 0.2 /100 | #262 | Tragic 83.5% |
| Iroquois | 0.2 /100 | #263 | Tragic 83.5% |
| Scotch-Irish | 0.1 /100 | #264 | Tragic 83.5% |