Ecuadorian vs Basque In Labor Force | Age 35-44
COMPARE
Ecuadorian
Basque
In Labor Force | Age 35-44
In Labor Force | Age 35-44 Comparison
Ecuadorians
Basques
84.2%
IN LABOR FORCE | AGE 35-44
24.0/ 100
METRIC RATING
198th/ 347
METRIC RANK
83.6%
IN LABOR FORCE | AGE 35-44
0.3/ 100
METRIC RATING
257th/ 347
METRIC RANK
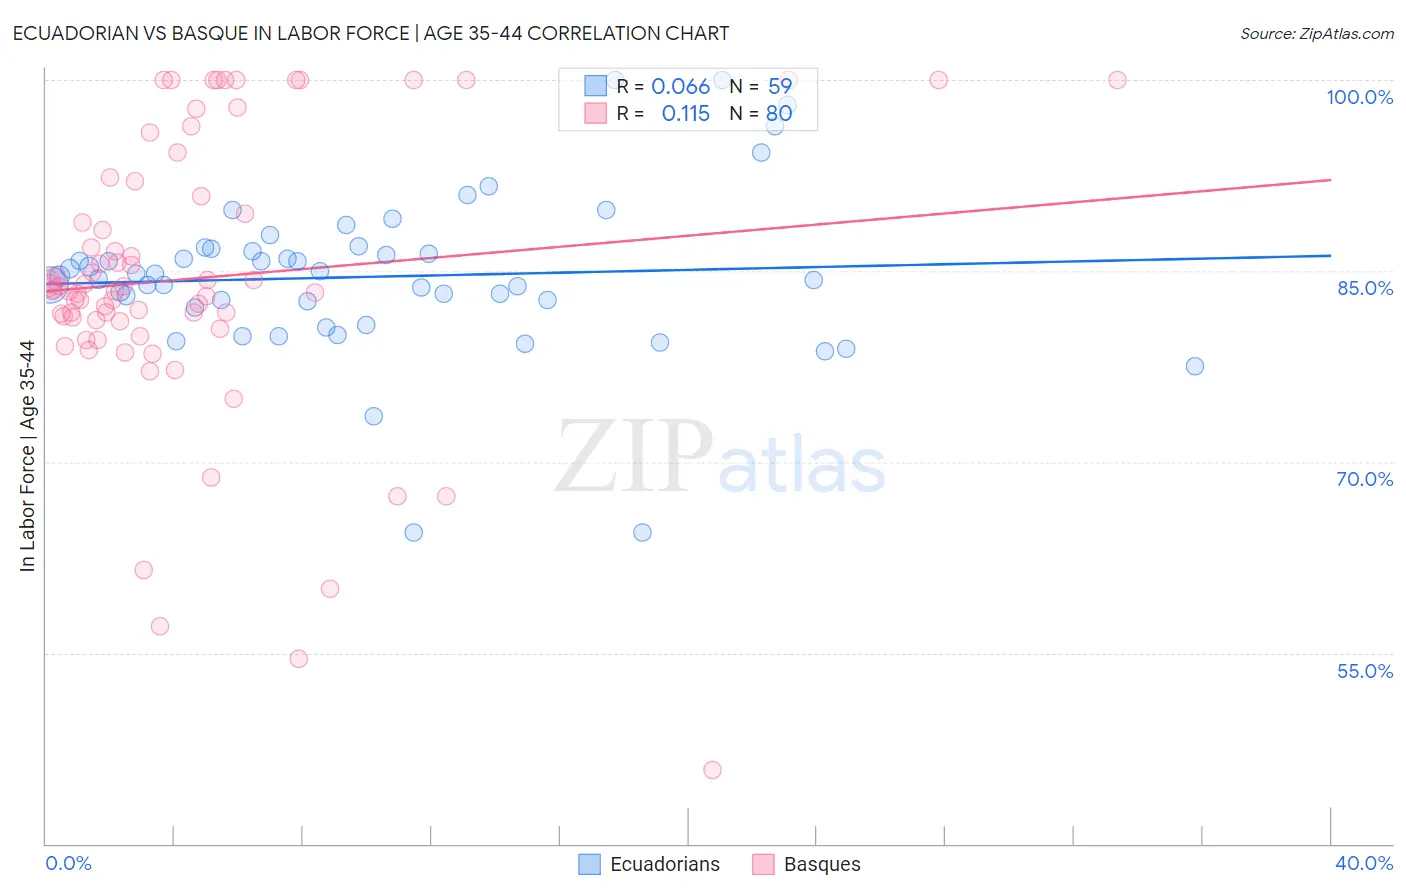
Ecuadorian vs Basque In Labor Force | Age 35-44 Correlation Chart
The statistical analysis conducted on geographies consisting of 317,693,933 people shows a slight positive correlation between the proportion of Ecuadorians and labor force participation rate among population between the ages 35 and 44 in the United States with a correlation coefficient (R) of 0.066 and weighted average of 84.2%. Similarly, the statistical analysis conducted on geographies consisting of 165,759,018 people shows a poor positive correlation between the proportion of Basques and labor force participation rate among population between the ages 35 and 44 in the United States with a correlation coefficient (R) of 0.115 and weighted average of 83.6%, a difference of 0.77%.
In Labor Force | Age 35-44 Correlation Summary
| Measurement | Ecuadorian | Basque |
| Minimum | 64.5% | 45.8% |
| Maximum | 100.0% | 100.0% |
| Range | 35.5% | 54.2% |
| Mean | 84.6% | 84.4% |
| Median | 84.6% | 83.5% |
| Interquartile 25% (IQ1) | 82.1% | 81.1% |
| Interquartile 75% (IQ3) | 86.8% | 91.4% |
| Interquartile Range (IQR) | 4.7% | 10.3% |
| Standard Deviation (Sample) | 6.4% | 11.1% |
| Standard Deviation (Population) | 6.3% | 11.0% |
Similar Demographics by In Labor Force | Age 35-44
Demographics Similar to Ecuadorians by In Labor Force | Age 35-44
In terms of in labor force | age 35-44, the demographic groups most similar to Ecuadorians are Immigrants from Caribbean (84.2%, a difference of 0.010%), Immigrants from England (84.2%, a difference of 0.010%), Immigrants from Western Europe (84.2%, a difference of 0.010%), Syrian (84.2%, a difference of 0.010%), and Moroccan (84.2%, a difference of 0.010%).
| Demographics | Rating | Rank | In Labor Force | Age 35-44 |
| Immigrants | Philippines | 27.9 /100 | #191 | Fair 84.2% |
| Immigrants | Vietnam | 27.4 /100 | #192 | Fair 84.2% |
| Hungarians | 26.8 /100 | #193 | Fair 84.2% |
| Immigrants | Indonesia | 25.7 /100 | #194 | Fair 84.2% |
| Immigrants | Caribbean | 25.7 /100 | #195 | Fair 84.2% |
| Immigrants | England | 25.0 /100 | #196 | Fair 84.2% |
| Immigrants | Western Europe | 24.7 /100 | #197 | Fair 84.2% |
| Ecuadorians | 24.0 /100 | #198 | Fair 84.2% |
| Syrians | 23.2 /100 | #199 | Fair 84.2% |
| Moroccans | 23.2 /100 | #200 | Fair 84.2% |
| British | 23.0 /100 | #201 | Fair 84.2% |
| Immigrants | Uzbekistan | 22.8 /100 | #202 | Fair 84.2% |
| Immigrants | South Eastern Asia | 22.4 /100 | #203 | Fair 84.2% |
| Canadians | 19.9 /100 | #204 | Poor 84.2% |
| Immigrants | Canada | 19.6 /100 | #205 | Poor 84.2% |
Demographics Similar to Basques by In Labor Force | Age 35-44
In terms of in labor force | age 35-44, the demographic groups most similar to Basques are Japanese (83.6%, a difference of 0.020%), Tsimshian (83.5%, a difference of 0.020%), Immigrants from the Azores (83.6%, a difference of 0.030%), Immigrants from El Salvador (83.5%, a difference of 0.050%), and Tongan (83.6%, a difference of 0.060%).
| Demographics | Rating | Rank | In Labor Force | Age 35-44 |
| Whites/Caucasians | 0.5 /100 | #250 | Tragic 83.6% |
| Salvadorans | 0.4 /100 | #251 | Tragic 83.6% |
| Immigrants | Guyana | 0.4 /100 | #252 | Tragic 83.6% |
| Lebanese | 0.4 /100 | #253 | Tragic 83.6% |
| Tongans | 0.4 /100 | #254 | Tragic 83.6% |
| Immigrants | Azores | 0.3 /100 | #255 | Tragic 83.6% |
| Japanese | 0.3 /100 | #256 | Tragic 83.6% |
| Basques | 0.3 /100 | #257 | Tragic 83.6% |
| Tsimshian | 0.2 /100 | #258 | Tragic 83.5% |
| Immigrants | El Salvador | 0.2 /100 | #259 | Tragic 83.5% |
| Vietnamese | 0.2 /100 | #260 | Tragic 83.5% |
| Immigrants | Dominica | 0.2 /100 | #261 | Tragic 83.5% |
| Immigrants | Congo | 0.2 /100 | #262 | Tragic 83.5% |
| Iroquois | 0.2 /100 | #263 | Tragic 83.5% |
| Scotch-Irish | 0.1 /100 | #264 | Tragic 83.5% |