Hmong vs Polish In Labor Force | Age 20-24
COMPARE
Hmong
Polish
In Labor Force | Age 20-24
In Labor Force | Age 20-24 Comparison
Hmong
Poles
76.5%
IN LABOR FORCE | AGE 20-24
99.5/ 100
METRIC RATING
82nd/ 347
METRIC RANK
77.6%
IN LABOR FORCE | AGE 20-24
100.0/ 100
METRIC RATING
31st/ 347
METRIC RANK
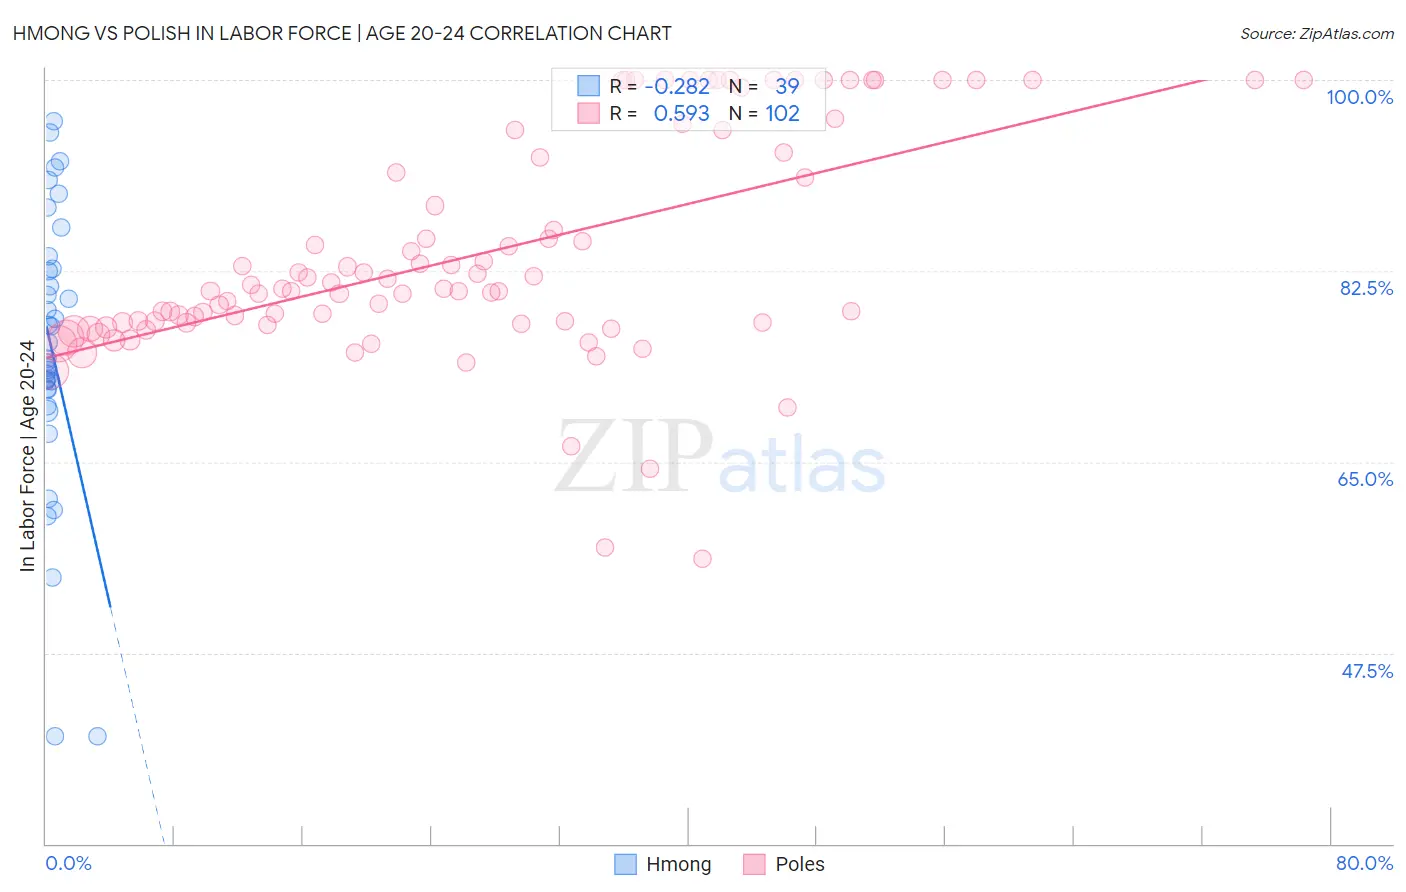
Hmong vs Polish In Labor Force | Age 20-24 Correlation Chart
The statistical analysis conducted on geographies consisting of 24,681,034 people shows a weak negative correlation between the proportion of Hmong and labor force participation rate among population between the ages 20 and 24 in the United States with a correlation coefficient (R) of -0.282 and weighted average of 76.5%. Similarly, the statistical analysis conducted on geographies consisting of 559,319,488 people shows a substantial positive correlation between the proportion of Poles and labor force participation rate among population between the ages 20 and 24 in the United States with a correlation coefficient (R) of 0.593 and weighted average of 77.6%, a difference of 1.4%.
In Labor Force | Age 20-24 Correlation Summary
| Measurement | Hmong | Polish |
| Minimum | 39.8% | 56.1% |
| Maximum | 96.2% | 100.0% |
| Range | 56.4% | 43.9% |
| Mean | 75.3% | 83.9% |
| Median | 74.5% | 80.8% |
| Interquartile 25% (IQ1) | 71.5% | 77.7% |
| Interquartile 75% (IQ3) | 82.7% | 92.9% |
| Interquartile Range (IQR) | 11.1% | 15.2% |
| Standard Deviation (Sample) | 12.8% | 10.1% |
| Standard Deviation (Population) | 12.6% | 10.1% |
Similar Demographics by In Labor Force | Age 20-24
Demographics Similar to Hmong by In Labor Force | Age 20-24
In terms of in labor force | age 20-24, the demographic groups most similar to Hmong are Basque (76.5%, a difference of 0.0%), Italian (76.5%, a difference of 0.020%), Immigrants from Zaire (76.6%, a difference of 0.040%), Canadian (76.6%, a difference of 0.060%), and Immigrants from Cameroon (76.6%, a difference of 0.070%).
| Demographics | Rating | Rank | In Labor Force | Age 20-24 |
| Immigrants | Middle Africa | 99.7 /100 | #75 | Exceptional 76.6% |
| Immigrants | Moldova | 99.6 /100 | #76 | Exceptional 76.6% |
| Immigrants | Cameroon | 99.6 /100 | #77 | Exceptional 76.6% |
| Canadians | 99.6 /100 | #78 | Exceptional 76.6% |
| Immigrants | Zaire | 99.6 /100 | #79 | Exceptional 76.6% |
| Italians | 99.6 /100 | #80 | Exceptional 76.5% |
| Basques | 99.5 /100 | #81 | Exceptional 76.5% |
| Hmong | 99.5 /100 | #82 | Exceptional 76.5% |
| Carpatho Rusyns | 99.4 /100 | #83 | Exceptional 76.5% |
| Austrians | 99.4 /100 | #84 | Exceptional 76.5% |
| Portuguese | 99.3 /100 | #85 | Exceptional 76.4% |
| Immigrants | Iraq | 99.3 /100 | #86 | Exceptional 76.4% |
| Immigrants | Thailand | 99.3 /100 | #87 | Exceptional 76.4% |
| Spanish | 99.2 /100 | #88 | Exceptional 76.4% |
| Bulgarians | 99.2 /100 | #89 | Exceptional 76.4% |
Demographics Similar to Poles by In Labor Force | Age 20-24
In terms of in labor force | age 20-24, the demographic groups most similar to Poles are English (77.6%, a difference of 0.060%), Immigrants from Ethiopia (77.5%, a difference of 0.11%), Swiss (77.7%, a difference of 0.12%), German Russian (77.5%, a difference of 0.12%), and Immigrants from Eastern Africa (77.5%, a difference of 0.13%).
| Demographics | Rating | Rank | In Labor Force | Age 20-24 |
| Liberians | 100.0 /100 | #24 | Exceptional 78.0% |
| Tlingit-Haida | 100.0 /100 | #25 | Exceptional 77.9% |
| Tongans | 100.0 /100 | #26 | Exceptional 77.9% |
| Immigrants | Micronesia | 100.0 /100 | #27 | Exceptional 77.8% |
| Belgians | 100.0 /100 | #28 | Exceptional 77.8% |
| Slovaks | 100.0 /100 | #29 | Exceptional 77.7% |
| Swiss | 100.0 /100 | #30 | Exceptional 77.7% |
| Poles | 100.0 /100 | #31 | Exceptional 77.6% |
| English | 100.0 /100 | #32 | Exceptional 77.6% |
| Immigrants | Ethiopia | 100.0 /100 | #33 | Exceptional 77.5% |
| German Russians | 100.0 /100 | #34 | Exceptional 77.5% |
| Immigrants | Eastern Africa | 100.0 /100 | #35 | Exceptional 77.5% |
| Welsh | 100.0 /100 | #36 | Exceptional 77.5% |
| Czechoslovakians | 100.0 /100 | #37 | Exceptional 77.5% |
| Marshallese | 100.0 /100 | #38 | Exceptional 77.4% |