Hmong vs Spanish American Indian In Labor Force | Age 20-24
COMPARE
Hmong
Spanish American Indian
In Labor Force | Age 20-24
In Labor Force | Age 20-24 Comparison
Hmong
Spanish American Indians
76.5%
IN LABOR FORCE | AGE 20-24
99.5/ 100
METRIC RATING
82nd/ 347
METRIC RANK
73.7%
IN LABOR FORCE | AGE 20-24
0.8/ 100
METRIC RATING
256th/ 347
METRIC RANK
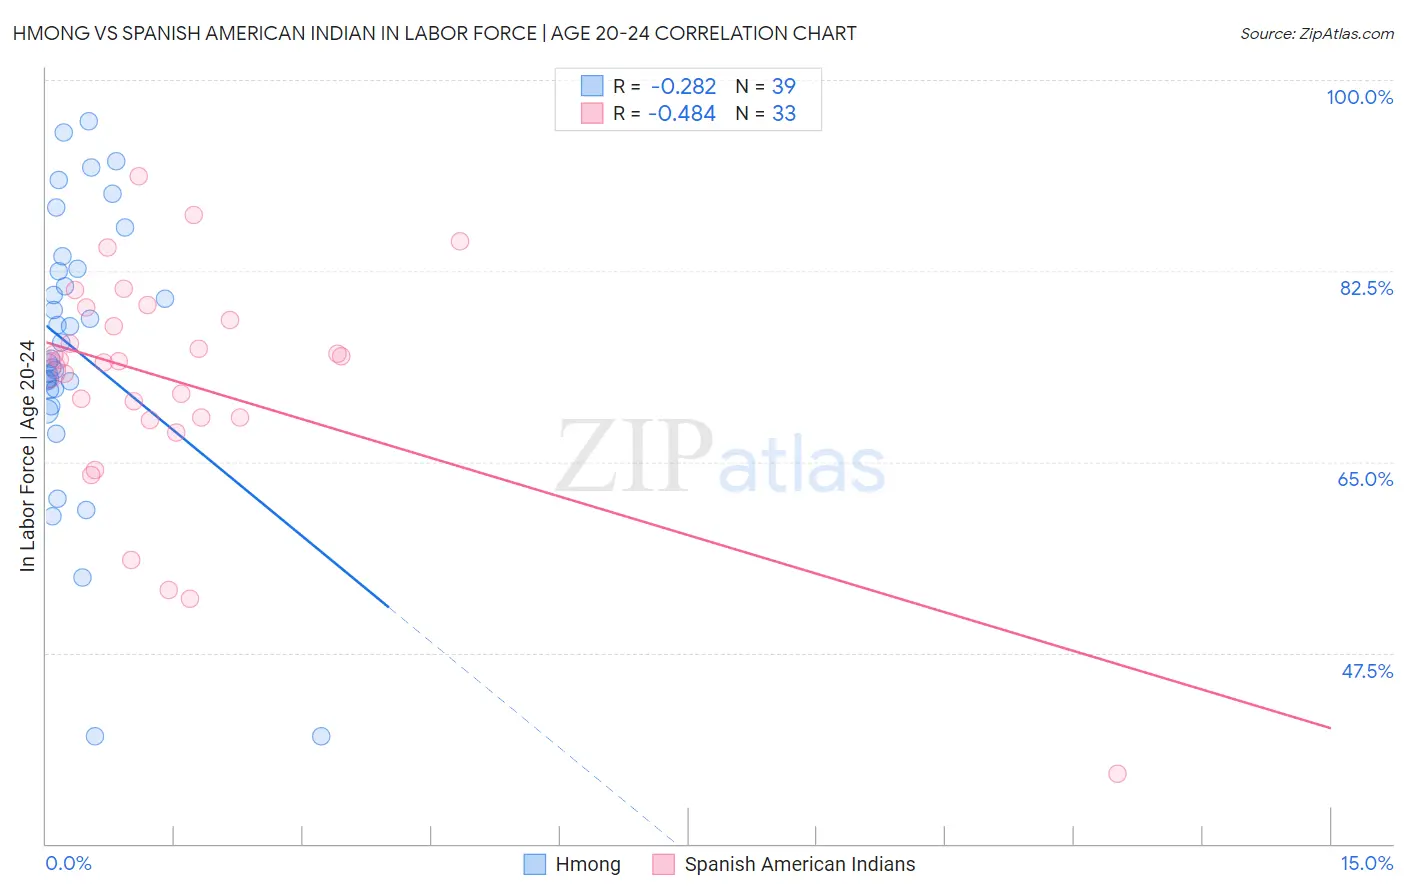
Hmong vs Spanish American Indian In Labor Force | Age 20-24 Correlation Chart
The statistical analysis conducted on geographies consisting of 24,681,034 people shows a weak negative correlation between the proportion of Hmong and labor force participation rate among population between the ages 20 and 24 in the United States with a correlation coefficient (R) of -0.282 and weighted average of 76.5%. Similarly, the statistical analysis conducted on geographies consisting of 73,146,145 people shows a moderate negative correlation between the proportion of Spanish American Indians and labor force participation rate among population between the ages 20 and 24 in the United States with a correlation coefficient (R) of -0.484 and weighted average of 73.7%, a difference of 3.8%.
In Labor Force | Age 20-24 Correlation Summary
| Measurement | Hmong | Spanish American Indian |
| Minimum | 39.8% | 36.4% |
| Maximum | 96.2% | 91.1% |
| Range | 56.4% | 54.7% |
| Mean | 75.3% | 72.2% |
| Median | 74.5% | 74.2% |
| Interquartile 25% (IQ1) | 71.5% | 68.9% |
| Interquartile 75% (IQ3) | 82.7% | 78.6% |
| Interquartile Range (IQR) | 11.1% | 9.7% |
| Standard Deviation (Sample) | 12.8% | 10.8% |
| Standard Deviation (Population) | 12.6% | 10.7% |
Similar Demographics by In Labor Force | Age 20-24
Demographics Similar to Hmong by In Labor Force | Age 20-24
In terms of in labor force | age 20-24, the demographic groups most similar to Hmong are Basque (76.5%, a difference of 0.0%), Italian (76.5%, a difference of 0.020%), Immigrants from Zaire (76.6%, a difference of 0.040%), Canadian (76.6%, a difference of 0.060%), and Immigrants from Cameroon (76.6%, a difference of 0.070%).
| Demographics | Rating | Rank | In Labor Force | Age 20-24 |
| Immigrants | Middle Africa | 99.7 /100 | #75 | Exceptional 76.6% |
| Immigrants | Moldova | 99.6 /100 | #76 | Exceptional 76.6% |
| Immigrants | Cameroon | 99.6 /100 | #77 | Exceptional 76.6% |
| Canadians | 99.6 /100 | #78 | Exceptional 76.6% |
| Immigrants | Zaire | 99.6 /100 | #79 | Exceptional 76.6% |
| Italians | 99.6 /100 | #80 | Exceptional 76.5% |
| Basques | 99.5 /100 | #81 | Exceptional 76.5% |
| Hmong | 99.5 /100 | #82 | Exceptional 76.5% |
| Carpatho Rusyns | 99.4 /100 | #83 | Exceptional 76.5% |
| Austrians | 99.4 /100 | #84 | Exceptional 76.5% |
| Portuguese | 99.3 /100 | #85 | Exceptional 76.4% |
| Immigrants | Iraq | 99.3 /100 | #86 | Exceptional 76.4% |
| Immigrants | Thailand | 99.3 /100 | #87 | Exceptional 76.4% |
| Spanish | 99.2 /100 | #88 | Exceptional 76.4% |
| Bulgarians | 99.2 /100 | #89 | Exceptional 76.4% |
Demographics Similar to Spanish American Indians by In Labor Force | Age 20-24
In terms of in labor force | age 20-24, the demographic groups most similar to Spanish American Indians are Paraguayan (73.7%, a difference of 0.020%), Immigrants from Pakistan (73.8%, a difference of 0.040%), Egyptian (73.7%, a difference of 0.060%), Arapaho (73.8%, a difference of 0.070%), and Ute (73.8%, a difference of 0.070%).
| Demographics | Rating | Rank | In Labor Force | Age 20-24 |
| Blacks/African Americans | 1.3 /100 | #249 | Tragic 73.9% |
| Immigrants | Belgium | 1.3 /100 | #250 | Tragic 73.9% |
| Immigrants | Egypt | 1.2 /100 | #251 | Tragic 73.8% |
| Immigrants | Kazakhstan | 1.1 /100 | #252 | Tragic 73.8% |
| Arapaho | 1.0 /100 | #253 | Tragic 73.8% |
| Ute | 1.0 /100 | #254 | Tragic 73.8% |
| Immigrants | Pakistan | 0.9 /100 | #255 | Tragic 73.8% |
| Spanish American Indians | 0.8 /100 | #256 | Tragic 73.7% |
| Paraguayans | 0.8 /100 | #257 | Tragic 73.7% |
| Egyptians | 0.7 /100 | #258 | Tragic 73.7% |
| Dutch West Indians | 0.7 /100 | #259 | Tragic 73.7% |
| Immigrants | Turkey | 0.7 /100 | #260 | Tragic 73.7% |
| Houma | 0.6 /100 | #261 | Tragic 73.7% |
| Asians | 0.6 /100 | #262 | Tragic 73.7% |
| Immigrants | Asia | 0.5 /100 | #263 | Tragic 73.6% |