Hmong vs Polish Births to Unmarried Women
COMPARE
Hmong
Polish
Births to Unmarried Women
Births to Unmarried Women Comparison
Hmong
Poles
27.7%
BIRTHS TO UNMARRIED WOMEN
99.5/ 100
METRIC RATING
47th/ 347
METRIC RANK
30.8%
BIRTHS TO UNMARRIED WOMEN
76.2/ 100
METRIC RATING
152nd/ 347
METRIC RANK
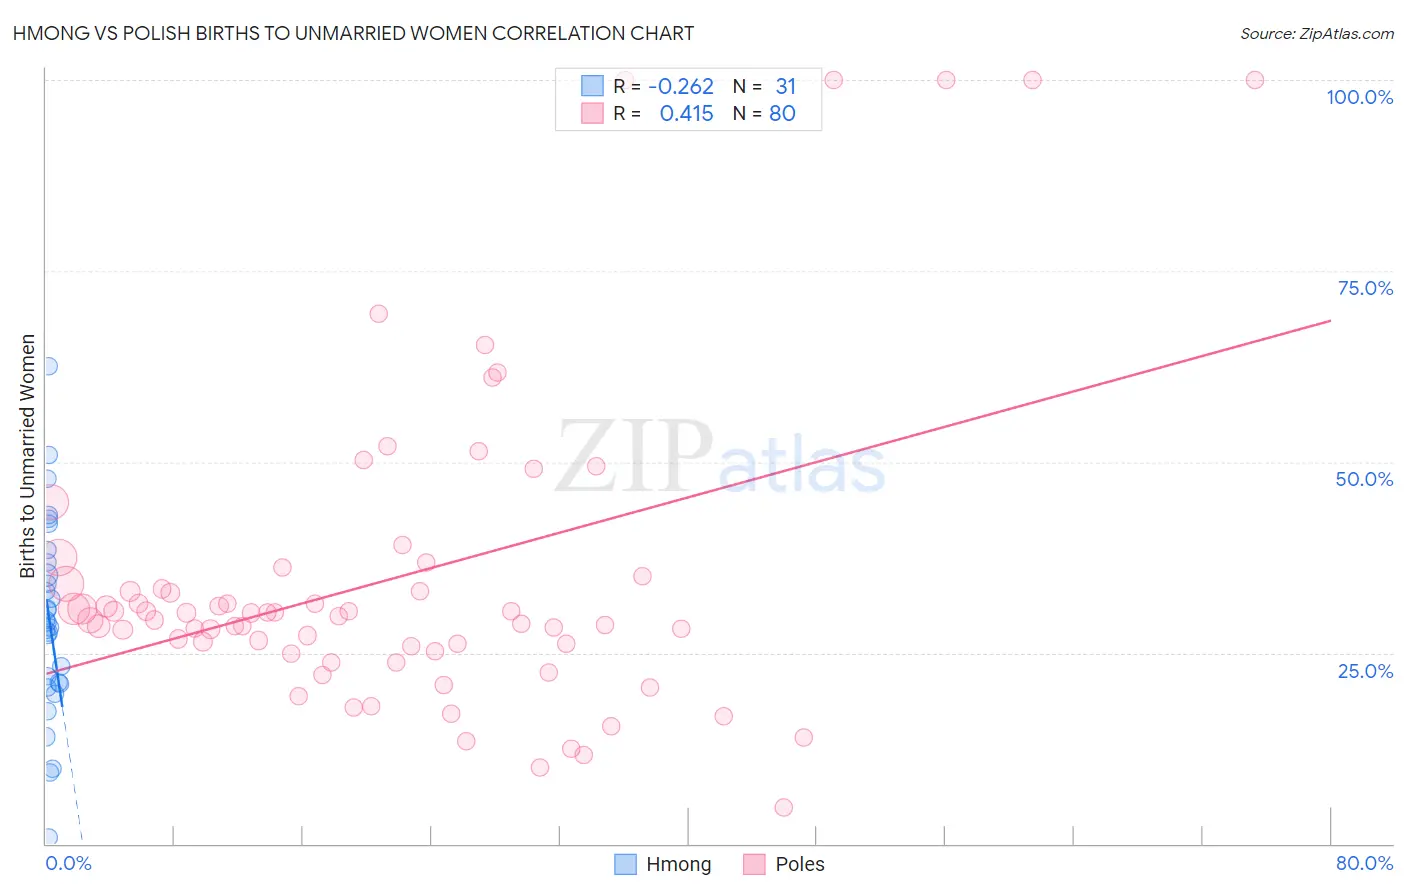
Hmong vs Polish Births to Unmarried Women Correlation Chart
The statistical analysis conducted on geographies consisting of 24,592,698 people shows a weak negative correlation between the proportion of Hmong and percentage of births to unmarried women in the United States with a correlation coefficient (R) of -0.262 and weighted average of 27.7%. Similarly, the statistical analysis conducted on geographies consisting of 497,645,952 people shows a moderate positive correlation between the proportion of Poles and percentage of births to unmarried women in the United States with a correlation coefficient (R) of 0.415 and weighted average of 30.8%, a difference of 11.0%.
Births to Unmarried Women Correlation Summary
| Measurement | Hmong | Polish |
| Minimum | 0.90% | 4.8% |
| Maximum | 62.6% | 100.0% |
| Range | 61.7% | 95.2% |
| Mean | 29.3% | 34.7% |
| Median | 29.0% | 30.0% |
| Interquartile 25% (IQ1) | 21.0% | 25.6% |
| Interquartile 75% (IQ3) | 36.9% | 34.5% |
| Interquartile Range (IQR) | 15.9% | 9.0% |
| Standard Deviation (Sample) | 13.0% | 20.7% |
| Standard Deviation (Population) | 12.7% | 20.6% |
Similar Demographics by Births to Unmarried Women
Demographics Similar to Hmong by Births to Unmarried Women
In terms of births to unmarried women, the demographic groups most similar to Hmong are Immigrants from Lithuania (27.7%, a difference of 0.0%), Eastern European (27.7%, a difference of 0.010%), Latvian (27.7%, a difference of 0.040%), Immigrants from Indonesia (27.7%, a difference of 0.14%), and Immigrants from Greece (27.8%, a difference of 0.20%).
| Demographics | Rating | Rank | Births to Unmarried Women |
| Turks | 99.6 /100 | #40 | Exceptional 27.4% |
| Iraqis | 99.6 /100 | #41 | Exceptional 27.6% |
| Immigrants | Eastern Europe | 99.6 /100 | #42 | Exceptional 27.6% |
| Immigrants | Bulgaria | 99.6 /100 | #43 | Exceptional 27.6% |
| Immigrants | Indonesia | 99.5 /100 | #44 | Exceptional 27.7% |
| Latvians | 99.5 /100 | #45 | Exceptional 27.7% |
| Immigrants | Lithuania | 99.5 /100 | #46 | Exceptional 27.7% |
| Hmong | 99.5 /100 | #47 | Exceptional 27.7% |
| Eastern Europeans | 99.5 /100 | #48 | Exceptional 27.7% |
| Immigrants | Greece | 99.4 /100 | #49 | Exceptional 27.8% |
| Maltese | 99.4 /100 | #50 | Exceptional 27.8% |
| Macedonians | 99.4 /100 | #51 | Exceptional 27.9% |
| Bhutanese | 99.4 /100 | #52 | Exceptional 27.9% |
| Immigrants | Romania | 99.4 /100 | #53 | Exceptional 27.9% |
| Afghans | 99.4 /100 | #54 | Exceptional 27.9% |
Demographics Similar to Poles by Births to Unmarried Women
In terms of births to unmarried women, the demographic groups most similar to Poles are British (30.8%, a difference of 0.020%), Italian (30.8%, a difference of 0.11%), Yugoslavian (30.8%, a difference of 0.14%), Somali (30.7%, a difference of 0.22%), and Immigrants from Bangladesh (30.9%, a difference of 0.29%).
| Demographics | Rating | Rank | Births to Unmarried Women |
| Immigrants | North America | 81.5 /100 | #145 | Excellent 30.6% |
| Northern Europeans | 81.4 /100 | #146 | Excellent 30.6% |
| Immigrants | Oceania | 81.2 /100 | #147 | Excellent 30.6% |
| Chileans | 79.1 /100 | #148 | Good 30.7% |
| Serbians | 78.8 /100 | #149 | Good 30.7% |
| Somalis | 77.8 /100 | #150 | Good 30.7% |
| Italians | 77.0 /100 | #151 | Good 30.8% |
| Poles | 76.2 /100 | #152 | Good 30.8% |
| British | 76.0 /100 | #153 | Good 30.8% |
| Yugoslavians | 75.1 /100 | #154 | Good 30.8% |
| Immigrants | Bangladesh | 73.9 /100 | #155 | Good 30.9% |
| Carpatho Rusyns | 73.5 /100 | #156 | Good 30.9% |
| Immigrants | Eastern Africa | 72.1 /100 | #157 | Good 31.0% |
| Austrians | 69.9 /100 | #158 | Good 31.0% |
| Immigrants | England | 69.4 /100 | #159 | Good 31.1% |