Ghanaian vs Polish In Labor Force | Age 20-24
COMPARE
Ghanaian
Polish
In Labor Force | Age 20-24
In Labor Force | Age 20-24 Comparison
Ghanaians
Poles
74.3%
IN LABOR FORCE | AGE 20-24
6.2/ 100
METRIC RATING
225th/ 347
METRIC RANK
77.6%
IN LABOR FORCE | AGE 20-24
100.0/ 100
METRIC RATING
31st/ 347
METRIC RANK
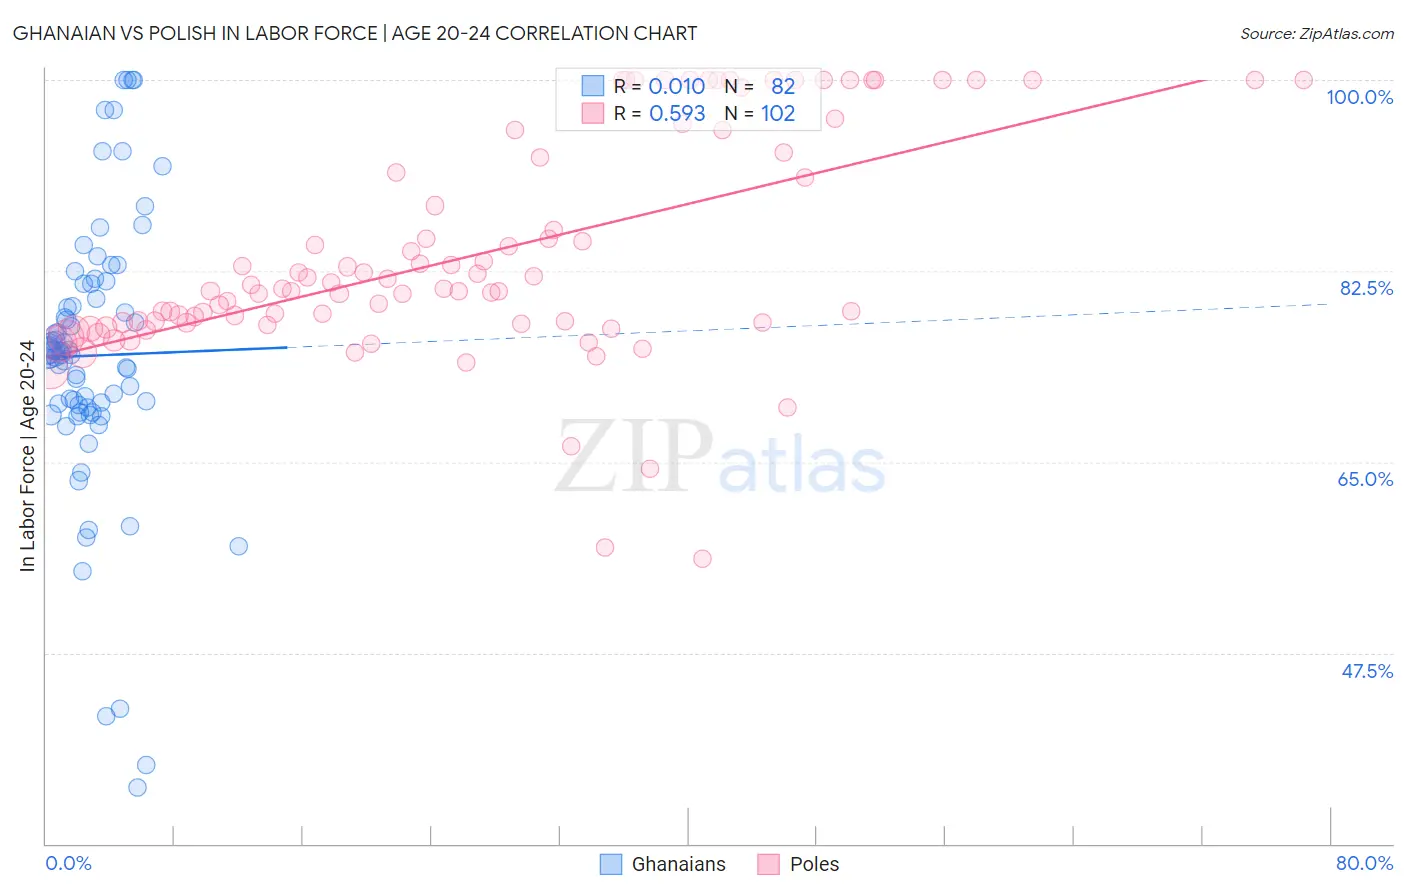
Ghanaian vs Polish In Labor Force | Age 20-24 Correlation Chart
The statistical analysis conducted on geographies consisting of 190,718,461 people shows no correlation between the proportion of Ghanaians and labor force participation rate among population between the ages 20 and 24 in the United States with a correlation coefficient (R) of 0.010 and weighted average of 74.3%. Similarly, the statistical analysis conducted on geographies consisting of 559,319,488 people shows a substantial positive correlation between the proportion of Poles and labor force participation rate among population between the ages 20 and 24 in the United States with a correlation coefficient (R) of 0.593 and weighted average of 77.6%, a difference of 4.4%.
In Labor Force | Age 20-24 Correlation Summary
| Measurement | Ghanaian | Polish |
| Minimum | 35.2% | 56.1% |
| Maximum | 100.0% | 100.0% |
| Range | 64.8% | 43.9% |
| Mean | 74.7% | 83.9% |
| Median | 75.1% | 80.8% |
| Interquartile 25% (IQ1) | 70.0% | 77.7% |
| Interquartile 75% (IQ3) | 81.3% | 92.9% |
| Interquartile Range (IQR) | 11.3% | 15.2% |
| Standard Deviation (Sample) | 12.7% | 10.1% |
| Standard Deviation (Population) | 12.6% | 10.1% |
Similar Demographics by In Labor Force | Age 20-24
Demographics Similar to Ghanaians by In Labor Force | Age 20-24
In terms of in labor force | age 20-24, the demographic groups most similar to Ghanaians are Immigrants from Fiji (74.3%, a difference of 0.020%), Immigrants from Ireland (74.3%, a difference of 0.030%), Seminole (74.3%, a difference of 0.040%), Immigrants from Ukraine (74.2%, a difference of 0.080%), and Hispanic or Latino (74.4%, a difference of 0.10%).
| Demographics | Rating | Rank | In Labor Force | Age 20-24 |
| Immigrants | Peru | 10.6 /100 | #218 | Poor 74.5% |
| Nepalese | 10.5 /100 | #219 | Poor 74.5% |
| Immigrants | Norway | 10.3 /100 | #220 | Poor 74.5% |
| Chickasaw | 10.3 /100 | #221 | Poor 74.5% |
| Immigrants | India | 9.9 /100 | #222 | Tragic 74.4% |
| Hispanics or Latinos | 7.9 /100 | #223 | Tragic 74.4% |
| Seminole | 6.9 /100 | #224 | Tragic 74.3% |
| Ghanaians | 6.2 /100 | #225 | Tragic 74.3% |
| Immigrants | Fiji | 5.9 /100 | #226 | Tragic 74.3% |
| Immigrants | Ireland | 5.8 /100 | #227 | Tragic 74.3% |
| Immigrants | Ukraine | 5.1 /100 | #228 | Tragic 74.2% |
| Immigrants | Sweden | 4.6 /100 | #229 | Tragic 74.2% |
| Immigrants | Albania | 4.3 /100 | #230 | Tragic 74.2% |
| Immigrants | Greece | 4.1 /100 | #231 | Tragic 74.2% |
| Immigrants | Switzerland | 4.1 /100 | #232 | Tragic 74.2% |
Demographics Similar to Poles by In Labor Force | Age 20-24
In terms of in labor force | age 20-24, the demographic groups most similar to Poles are English (77.6%, a difference of 0.060%), Immigrants from Ethiopia (77.5%, a difference of 0.11%), Swiss (77.7%, a difference of 0.12%), German Russian (77.5%, a difference of 0.12%), and Immigrants from Eastern Africa (77.5%, a difference of 0.13%).
| Demographics | Rating | Rank | In Labor Force | Age 20-24 |
| Liberians | 100.0 /100 | #24 | Exceptional 78.0% |
| Tlingit-Haida | 100.0 /100 | #25 | Exceptional 77.9% |
| Tongans | 100.0 /100 | #26 | Exceptional 77.9% |
| Immigrants | Micronesia | 100.0 /100 | #27 | Exceptional 77.8% |
| Belgians | 100.0 /100 | #28 | Exceptional 77.8% |
| Slovaks | 100.0 /100 | #29 | Exceptional 77.7% |
| Swiss | 100.0 /100 | #30 | Exceptional 77.7% |
| Poles | 100.0 /100 | #31 | Exceptional 77.6% |
| English | 100.0 /100 | #32 | Exceptional 77.6% |
| Immigrants | Ethiopia | 100.0 /100 | #33 | Exceptional 77.5% |
| German Russians | 100.0 /100 | #34 | Exceptional 77.5% |
| Immigrants | Eastern Africa | 100.0 /100 | #35 | Exceptional 77.5% |
| Welsh | 100.0 /100 | #36 | Exceptional 77.5% |
| Czechoslovakians | 100.0 /100 | #37 | Exceptional 77.5% |
| Marshallese | 100.0 /100 | #38 | Exceptional 77.4% |