Hmong vs Senegalese In Labor Force | Age 20-24
COMPARE
Hmong
Senegalese
In Labor Force | Age 20-24
In Labor Force | Age 20-24 Comparison
Hmong
Senegalese
76.5%
IN LABOR FORCE | AGE 20-24
99.5/ 100
METRIC RATING
82nd/ 347
METRIC RANK
74.8%
IN LABOR FORCE | AGE 20-24
28.1/ 100
METRIC RATING
191st/ 347
METRIC RANK
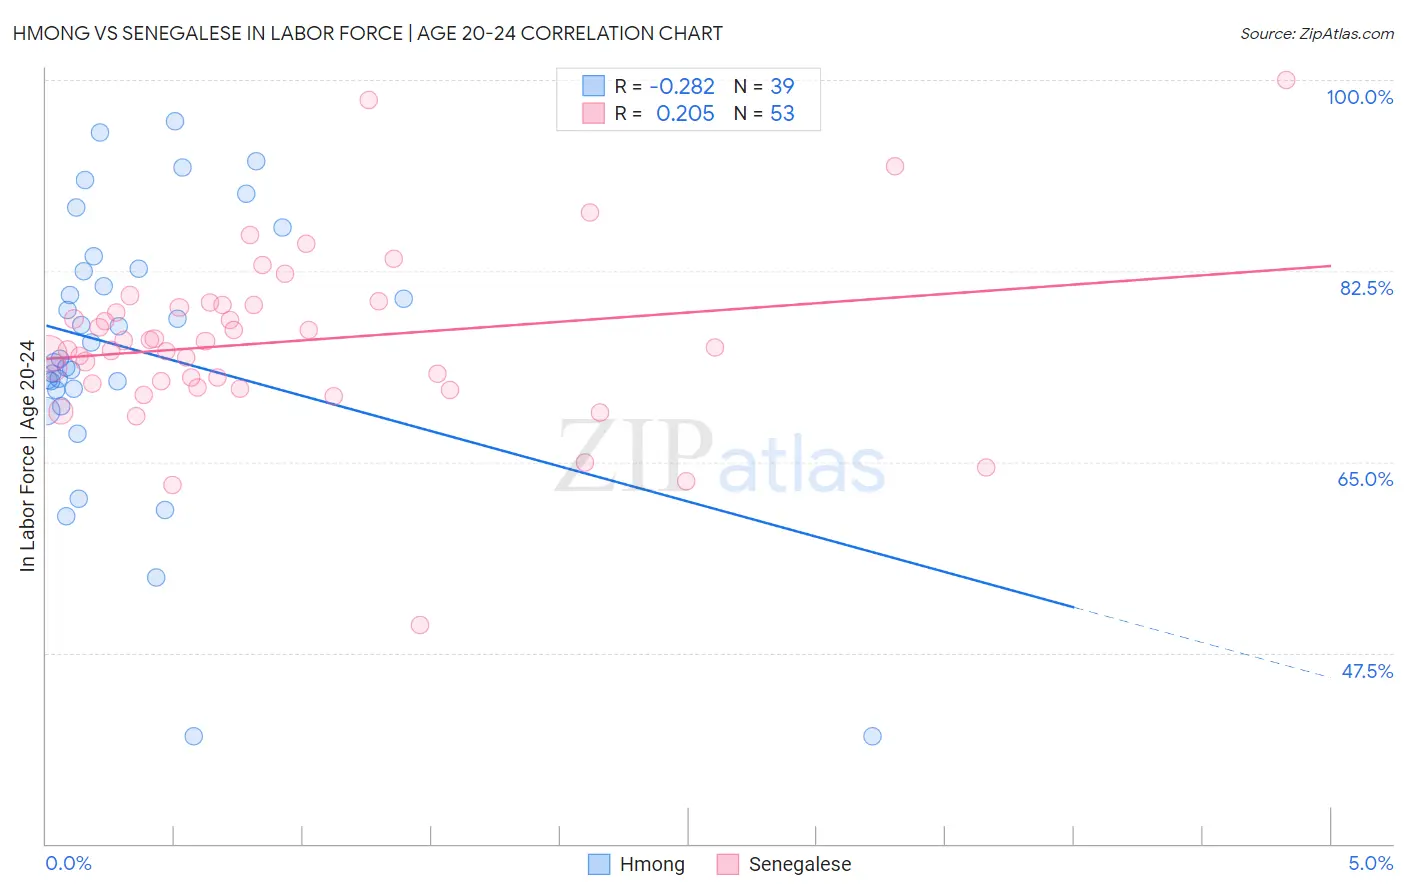
Hmong vs Senegalese In Labor Force | Age 20-24 Correlation Chart
The statistical analysis conducted on geographies consisting of 24,681,034 people shows a weak negative correlation between the proportion of Hmong and labor force participation rate among population between the ages 20 and 24 in the United States with a correlation coefficient (R) of -0.282 and weighted average of 76.5%. Similarly, the statistical analysis conducted on geographies consisting of 78,141,567 people shows a weak positive correlation between the proportion of Senegalese and labor force participation rate among population between the ages 20 and 24 in the United States with a correlation coefficient (R) of 0.205 and weighted average of 74.8%, a difference of 2.3%.
In Labor Force | Age 20-24 Correlation Summary
| Measurement | Hmong | Senegalese |
| Minimum | 39.8% | 50.0% |
| Maximum | 96.2% | 100.0% |
| Range | 56.4% | 50.0% |
| Mean | 75.3% | 76.1% |
| Median | 74.5% | 75.5% |
| Interquartile 25% (IQ1) | 71.5% | 72.0% |
| Interquartile 75% (IQ3) | 82.7% | 79.4% |
| Interquartile Range (IQR) | 11.1% | 7.4% |
| Standard Deviation (Sample) | 12.8% | 8.2% |
| Standard Deviation (Population) | 12.6% | 8.1% |
Similar Demographics by In Labor Force | Age 20-24
Demographics Similar to Hmong by In Labor Force | Age 20-24
In terms of in labor force | age 20-24, the demographic groups most similar to Hmong are Basque (76.5%, a difference of 0.0%), Italian (76.5%, a difference of 0.020%), Immigrants from Zaire (76.6%, a difference of 0.040%), Canadian (76.6%, a difference of 0.060%), and Immigrants from Cameroon (76.6%, a difference of 0.070%).
| Demographics | Rating | Rank | In Labor Force | Age 20-24 |
| Immigrants | Middle Africa | 99.7 /100 | #75 | Exceptional 76.6% |
| Immigrants | Moldova | 99.6 /100 | #76 | Exceptional 76.6% |
| Immigrants | Cameroon | 99.6 /100 | #77 | Exceptional 76.6% |
| Canadians | 99.6 /100 | #78 | Exceptional 76.6% |
| Immigrants | Zaire | 99.6 /100 | #79 | Exceptional 76.6% |
| Italians | 99.6 /100 | #80 | Exceptional 76.5% |
| Basques | 99.5 /100 | #81 | Exceptional 76.5% |
| Hmong | 99.5 /100 | #82 | Exceptional 76.5% |
| Carpatho Rusyns | 99.4 /100 | #83 | Exceptional 76.5% |
| Austrians | 99.4 /100 | #84 | Exceptional 76.5% |
| Portuguese | 99.3 /100 | #85 | Exceptional 76.4% |
| Immigrants | Iraq | 99.3 /100 | #86 | Exceptional 76.4% |
| Immigrants | Thailand | 99.3 /100 | #87 | Exceptional 76.4% |
| Spanish | 99.2 /100 | #88 | Exceptional 76.4% |
| Bulgarians | 99.2 /100 | #89 | Exceptional 76.4% |
Demographics Similar to Senegalese by In Labor Force | Age 20-24
In terms of in labor force | age 20-24, the demographic groups most similar to Senegalese are Immigrants from Europe (74.8%, a difference of 0.010%), Alsatian (74.8%, a difference of 0.020%), Immigrants from Denmark (74.8%, a difference of 0.040%), Eastern European (74.8%, a difference of 0.050%), and Immigrants from Vietnam (74.7%, a difference of 0.060%).
| Demographics | Rating | Rank | In Labor Force | Age 20-24 |
| Immigrants | Hungary | 35.0 /100 | #184 | Fair 74.9% |
| Sri Lankans | 34.9 /100 | #185 | Fair 74.9% |
| Immigrants | Eastern Europe | 33.8 /100 | #186 | Fair 74.9% |
| Immigrants | Honduras | 33.5 /100 | #187 | Fair 74.9% |
| Hondurans | 32.7 /100 | #188 | Fair 74.8% |
| Immigrants | Northern Europe | 32.6 /100 | #189 | Fair 74.8% |
| Russians | 32.2 /100 | #190 | Fair 74.8% |
| Senegalese | 28.1 /100 | #191 | Fair 74.8% |
| Immigrants | Europe | 27.5 /100 | #192 | Fair 74.8% |
| Alsatians | 27.1 /100 | #193 | Fair 74.8% |
| Immigrants | Denmark | 25.8 /100 | #194 | Fair 74.8% |
| Eastern Europeans | 25.4 /100 | #195 | Fair 74.8% |
| Immigrants | Vietnam | 25.1 /100 | #196 | Fair 74.7% |
| Panamanians | 25.0 /100 | #197 | Fair 74.7% |
| Immigrants | Nigeria | 24.2 /100 | #198 | Fair 74.7% |