Immigrants from Europe vs Polish In Labor Force | Age 20-24
COMPARE
Immigrants from Europe
Polish
In Labor Force | Age 20-24
In Labor Force | Age 20-24 Comparison
Immigrants from Europe
Poles
74.8%
IN LABOR FORCE | AGE 20-24
27.5/ 100
METRIC RATING
192nd/ 347
METRIC RANK
77.6%
IN LABOR FORCE | AGE 20-24
100.0/ 100
METRIC RATING
31st/ 347
METRIC RANK
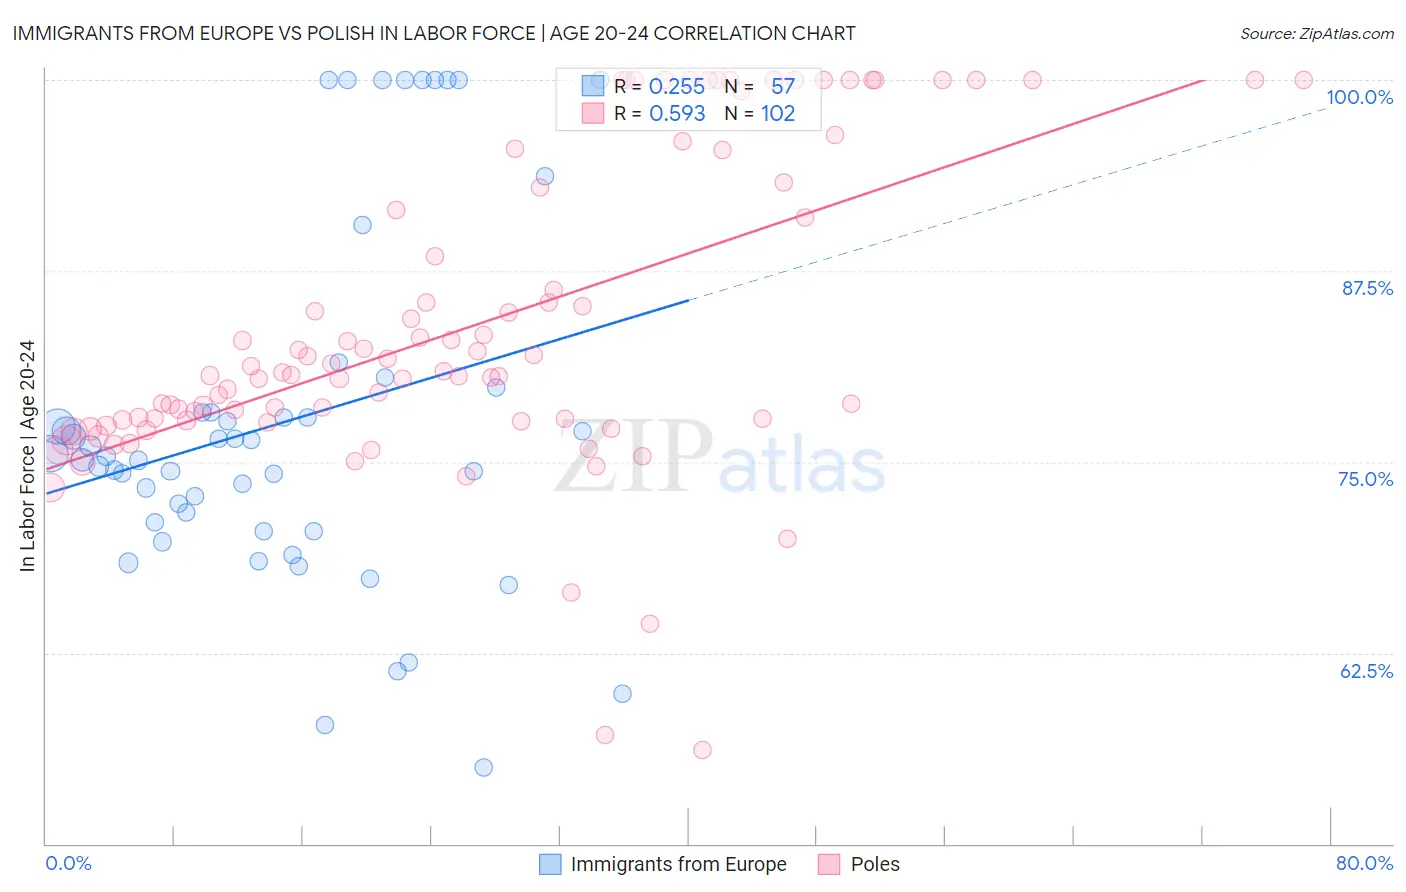
Immigrants from Europe vs Polish In Labor Force | Age 20-24 Correlation Chart
The statistical analysis conducted on geographies consisting of 546,529,081 people shows a weak positive correlation between the proportion of Immigrants from Europe and labor force participation rate among population between the ages 20 and 24 in the United States with a correlation coefficient (R) of 0.255 and weighted average of 74.8%. Similarly, the statistical analysis conducted on geographies consisting of 559,319,488 people shows a substantial positive correlation between the proportion of Poles and labor force participation rate among population between the ages 20 and 24 in the United States with a correlation coefficient (R) of 0.593 and weighted average of 77.6%, a difference of 3.8%.
In Labor Force | Age 20-24 Correlation Summary
| Measurement | Immigrants from Europe | Polish |
| Minimum | 55.0% | 56.1% |
| Maximum | 100.0% | 100.0% |
| Range | 45.0% | 43.9% |
| Mean | 77.7% | 83.9% |
| Median | 75.4% | 80.8% |
| Interquartile 25% (IQ1) | 70.8% | 77.7% |
| Interquartile 75% (IQ3) | 79.1% | 92.9% |
| Interquartile Range (IQR) | 8.3% | 15.2% |
| Standard Deviation (Sample) | 11.7% | 10.1% |
| Standard Deviation (Population) | 11.6% | 10.1% |
Similar Demographics by In Labor Force | Age 20-24
Demographics Similar to Immigrants from Europe by In Labor Force | Age 20-24
In terms of in labor force | age 20-24, the demographic groups most similar to Immigrants from Europe are Senegalese (74.8%, a difference of 0.010%), Alsatian (74.8%, a difference of 0.010%), Immigrants from Denmark (74.8%, a difference of 0.030%), Eastern European (74.8%, a difference of 0.040%), and Immigrants from Vietnam (74.7%, a difference of 0.050%).
| Demographics | Rating | Rank | In Labor Force | Age 20-24 |
| Sri Lankans | 34.9 /100 | #185 | Fair 74.9% |
| Immigrants | Eastern Europe | 33.8 /100 | #186 | Fair 74.9% |
| Immigrants | Honduras | 33.5 /100 | #187 | Fair 74.9% |
| Hondurans | 32.7 /100 | #188 | Fair 74.8% |
| Immigrants | Northern Europe | 32.6 /100 | #189 | Fair 74.8% |
| Russians | 32.2 /100 | #190 | Fair 74.8% |
| Senegalese | 28.1 /100 | #191 | Fair 74.8% |
| Immigrants | Europe | 27.5 /100 | #192 | Fair 74.8% |
| Alsatians | 27.1 /100 | #193 | Fair 74.8% |
| Immigrants | Denmark | 25.8 /100 | #194 | Fair 74.8% |
| Eastern Europeans | 25.4 /100 | #195 | Fair 74.8% |
| Immigrants | Vietnam | 25.1 /100 | #196 | Fair 74.7% |
| Panamanians | 25.0 /100 | #197 | Fair 74.7% |
| Immigrants | Nigeria | 24.2 /100 | #198 | Fair 74.7% |
| Taiwanese | 23.2 /100 | #199 | Fair 74.7% |
Demographics Similar to Poles by In Labor Force | Age 20-24
In terms of in labor force | age 20-24, the demographic groups most similar to Poles are English (77.6%, a difference of 0.060%), Immigrants from Ethiopia (77.5%, a difference of 0.11%), Swiss (77.7%, a difference of 0.12%), German Russian (77.5%, a difference of 0.12%), and Immigrants from Eastern Africa (77.5%, a difference of 0.13%).
| Demographics | Rating | Rank | In Labor Force | Age 20-24 |
| Liberians | 100.0 /100 | #24 | Exceptional 78.0% |
| Tlingit-Haida | 100.0 /100 | #25 | Exceptional 77.9% |
| Tongans | 100.0 /100 | #26 | Exceptional 77.9% |
| Immigrants | Micronesia | 100.0 /100 | #27 | Exceptional 77.8% |
| Belgians | 100.0 /100 | #28 | Exceptional 77.8% |
| Slovaks | 100.0 /100 | #29 | Exceptional 77.7% |
| Swiss | 100.0 /100 | #30 | Exceptional 77.7% |
| Poles | 100.0 /100 | #31 | Exceptional 77.6% |
| English | 100.0 /100 | #32 | Exceptional 77.6% |
| Immigrants | Ethiopia | 100.0 /100 | #33 | Exceptional 77.5% |
| German Russians | 100.0 /100 | #34 | Exceptional 77.5% |
| Immigrants | Eastern Africa | 100.0 /100 | #35 | Exceptional 77.5% |
| Welsh | 100.0 /100 | #36 | Exceptional 77.5% |
| Czechoslovakians | 100.0 /100 | #37 | Exceptional 77.5% |
| Marshallese | 100.0 /100 | #38 | Exceptional 77.4% |