Arapaho vs Scotch-Irish In Labor Force | Age 20-64
COMPARE
Arapaho
Scotch-Irish
In Labor Force | Age 20-64
In Labor Force | Age 20-64 Comparison
Arapaho
Scotch-Irish
74.4%
IN LABOR FORCE | AGE 20-64
0.0/ 100
METRIC RATING
332nd/ 347
METRIC RANK
78.3%
IN LABOR FORCE | AGE 20-64
0.0/ 100
METRIC RATING
270th/ 347
METRIC RANK
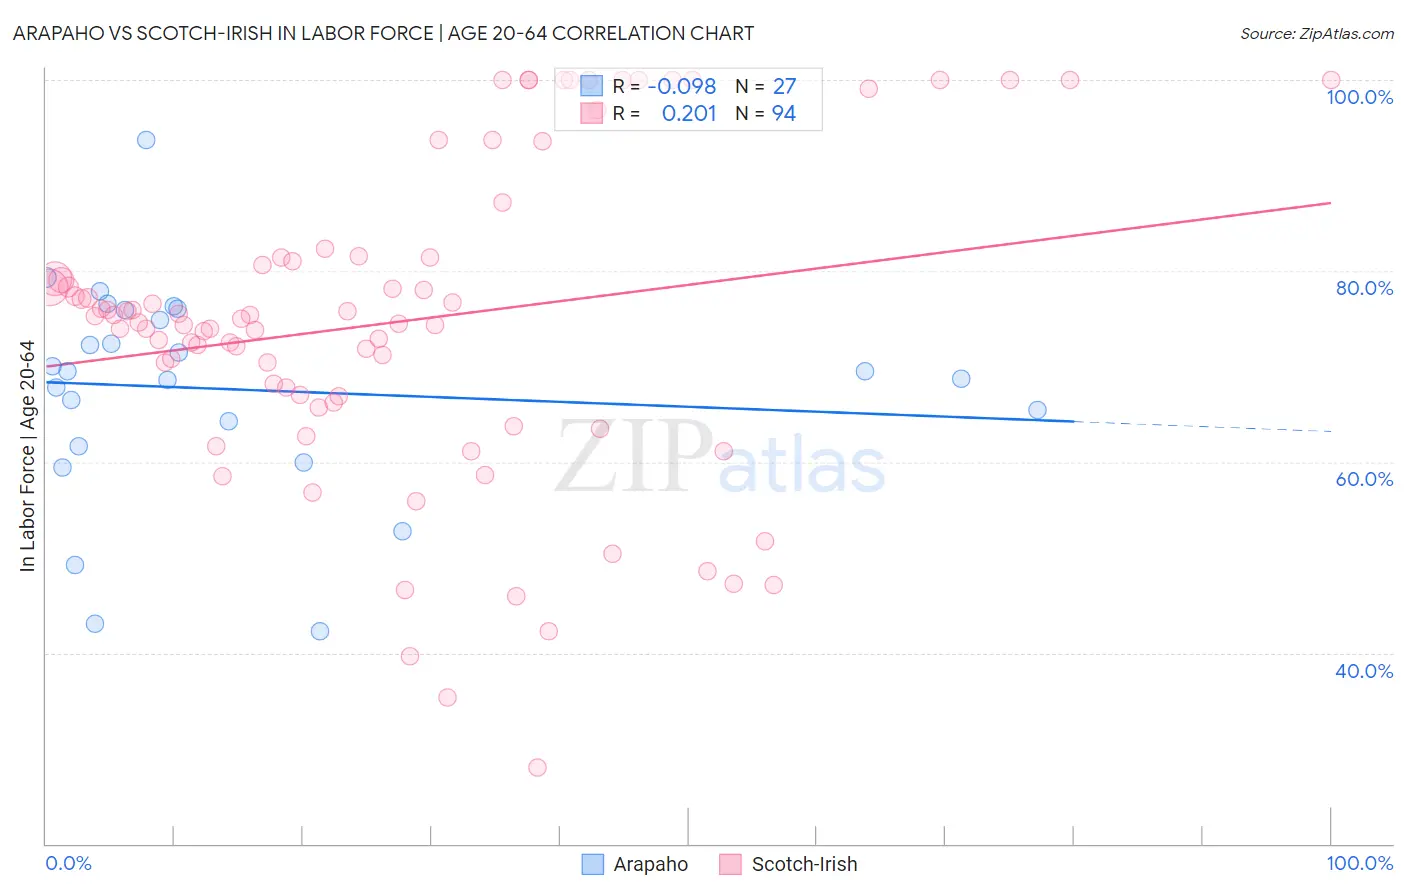
Arapaho vs Scotch-Irish In Labor Force | Age 20-64 Correlation Chart
The statistical analysis conducted on geographies consisting of 29,780,325 people shows a slight negative correlation between the proportion of Arapaho and labor force participation rate among population between the ages 20 and 64 in the United States with a correlation coefficient (R) of -0.098 and weighted average of 74.4%. Similarly, the statistical analysis conducted on geographies consisting of 548,766,362 people shows a weak positive correlation between the proportion of Scotch-Irish and labor force participation rate among population between the ages 20 and 64 in the United States with a correlation coefficient (R) of 0.201 and weighted average of 78.3%, a difference of 5.2%.
In Labor Force | Age 20-64 Correlation Summary
| Measurement | Arapaho | Scotch-Irish |
| Minimum | 42.2% | 28.0% |
| Maximum | 93.7% | 100.0% |
| Range | 51.5% | 72.0% |
| Mean | 67.6% | 74.6% |
| Median | 69.5% | 74.8% |
| Interquartile 25% (IQ1) | 61.7% | 66.9% |
| Interquartile 75% (IQ3) | 75.9% | 81.3% |
| Interquartile Range (IQR) | 14.2% | 14.5% |
| Standard Deviation (Sample) | 11.3% | 16.5% |
| Standard Deviation (Population) | 11.1% | 16.4% |
Similar Demographics by In Labor Force | Age 20-64
Demographics Similar to Arapaho by In Labor Force | Age 20-64
In terms of in labor force | age 20-64, the demographic groups most similar to Arapaho are Paiute (74.7%, a difference of 0.40%), Colville (74.8%, a difference of 0.54%), Cheyenne (74.8%, a difference of 0.60%), Native/Alaskan (73.9%, a difference of 0.66%), and Kiowa (75.0%, a difference of 0.80%).
| Demographics | Rating | Rank | In Labor Force | Age 20-64 |
| Menominee | 0.0 /100 | #325 | Tragic 75.3% |
| Creek | 0.0 /100 | #326 | Tragic 75.1% |
| Sioux | 0.0 /100 | #327 | Tragic 75.0% |
| Kiowa | 0.0 /100 | #328 | Tragic 75.0% |
| Cheyenne | 0.0 /100 | #329 | Tragic 74.8% |
| Colville | 0.0 /100 | #330 | Tragic 74.8% |
| Paiute | 0.0 /100 | #331 | Tragic 74.7% |
| Arapaho | 0.0 /100 | #332 | Tragic 74.4% |
| Natives/Alaskans | 0.0 /100 | #333 | Tragic 73.9% |
| Apache | 0.0 /100 | #334 | Tragic 73.7% |
| Ute | 0.0 /100 | #335 | Tragic 73.7% |
| Crow | 0.0 /100 | #336 | Tragic 73.3% |
| Yup'ik | 0.0 /100 | #337 | Tragic 73.2% |
| Puerto Ricans | 0.0 /100 | #338 | Tragic 73.1% |
| Houma | 0.0 /100 | #339 | Tragic 72.7% |
Demographics Similar to Scotch-Irish by In Labor Force | Age 20-64
In terms of in labor force | age 20-64, the demographic groups most similar to Scotch-Irish are Immigrants from Barbados (78.3%, a difference of 0.020%), Immigrants from Latin America (78.3%, a difference of 0.020%), Marshallese (78.3%, a difference of 0.020%), French American Indian (78.2%, a difference of 0.070%), and West Indian (78.3%, a difference of 0.080%).
| Demographics | Rating | Rank | In Labor Force | Age 20-64 |
| Pennsylvania Germans | 0.1 /100 | #263 | Tragic 78.4% |
| Spaniards | 0.1 /100 | #264 | Tragic 78.4% |
| British West Indians | 0.1 /100 | #265 | Tragic 78.4% |
| Bahamians | 0.1 /100 | #266 | Tragic 78.4% |
| U.S. Virgin Islanders | 0.1 /100 | #267 | Tragic 78.4% |
| West Indians | 0.0 /100 | #268 | Tragic 78.3% |
| Immigrants | Barbados | 0.0 /100 | #269 | Tragic 78.3% |
| Scotch-Irish | 0.0 /100 | #270 | Tragic 78.3% |
| Immigrants | Latin America | 0.0 /100 | #271 | Tragic 78.3% |
| Marshallese | 0.0 /100 | #272 | Tragic 78.3% |
| French American Indians | 0.0 /100 | #273 | Tragic 78.2% |
| Aleuts | 0.0 /100 | #274 | Tragic 78.2% |
| Spanish | 0.0 /100 | #275 | Tragic 78.2% |
| Puget Sound Salish | 0.0 /100 | #276 | Tragic 78.2% |
| Immigrants | Bahamas | 0.0 /100 | #277 | Tragic 78.2% |