Immigrants from Laos vs Scotch-Irish In Labor Force | Age 20-64
COMPARE
Immigrants from Laos
Scotch-Irish
In Labor Force | Age 20-64
In Labor Force | Age 20-64 Comparison
Immigrants from Laos
Scotch-Irish
79.4%
IN LABOR FORCE | AGE 20-64
21.5/ 100
METRIC RATING
198th/ 347
METRIC RANK
78.3%
IN LABOR FORCE | AGE 20-64
0.0/ 100
METRIC RATING
270th/ 347
METRIC RANK
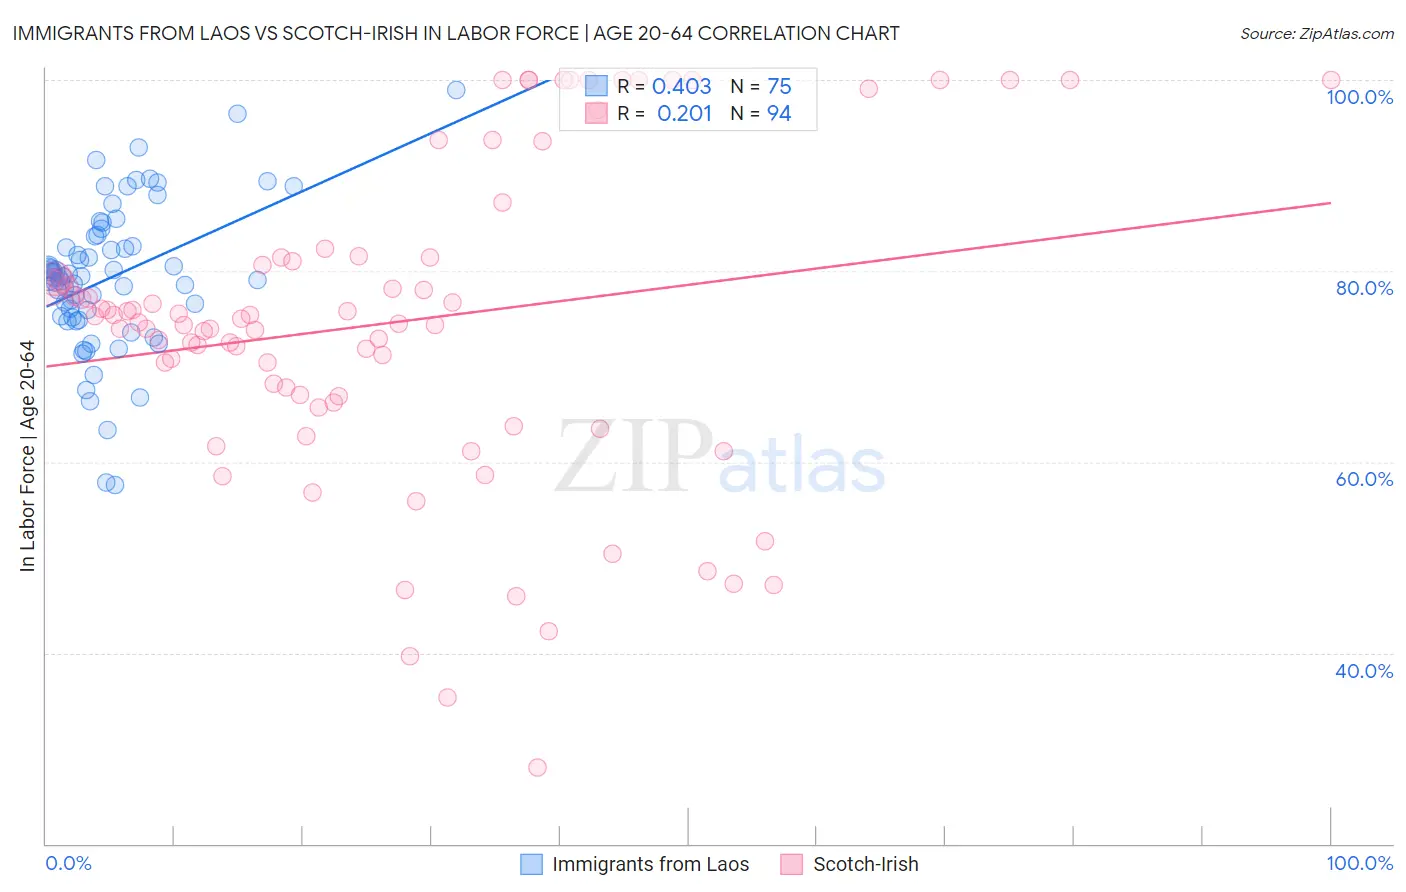
Immigrants from Laos vs Scotch-Irish In Labor Force | Age 20-64 Correlation Chart
The statistical analysis conducted on geographies consisting of 201,472,341 people shows a moderate positive correlation between the proportion of Immigrants from Laos and labor force participation rate among population between the ages 20 and 64 in the United States with a correlation coefficient (R) of 0.403 and weighted average of 79.4%. Similarly, the statistical analysis conducted on geographies consisting of 548,766,362 people shows a weak positive correlation between the proportion of Scotch-Irish and labor force participation rate among population between the ages 20 and 64 in the United States with a correlation coefficient (R) of 0.201 and weighted average of 78.3%, a difference of 1.4%.
In Labor Force | Age 20-64 Correlation Summary
| Measurement | Immigrants from Laos | Scotch-Irish |
| Minimum | 57.6% | 28.0% |
| Maximum | 98.9% | 100.0% |
| Range | 41.3% | 72.0% |
| Mean | 79.3% | 74.6% |
| Median | 79.4% | 74.8% |
| Interquartile 25% (IQ1) | 75.1% | 66.9% |
| Interquartile 75% (IQ3) | 83.6% | 81.3% |
| Interquartile Range (IQR) | 8.5% | 14.5% |
| Standard Deviation (Sample) | 7.7% | 16.5% |
| Standard Deviation (Population) | 7.6% | 16.4% |
Similar Demographics by In Labor Force | Age 20-64
Demographics Similar to Immigrants from Laos by In Labor Force | Age 20-64
In terms of in labor force | age 20-64, the demographic groups most similar to Immigrants from Laos are Immigrants from Senegal (79.4%, a difference of 0.010%), Ecuadorian (79.4%, a difference of 0.020%), Dutch (79.3%, a difference of 0.020%), Immigrants from Austria (79.4%, a difference of 0.030%), and Immigrants from Oceania (79.3%, a difference of 0.030%).
| Demographics | Rating | Rank | In Labor Force | Age 20-64 |
| Swiss | 28.9 /100 | #191 | Fair 79.4% |
| Immigrants | Denmark | 26.9 /100 | #192 | Fair 79.4% |
| Indonesians | 26.1 /100 | #193 | Fair 79.4% |
| Immigrants | Thailand | 24.8 /100 | #194 | Fair 79.4% |
| Immigrants | Austria | 23.7 /100 | #195 | Fair 79.4% |
| Ecuadorians | 23.1 /100 | #196 | Fair 79.4% |
| Immigrants | Senegal | 22.5 /100 | #197 | Fair 79.4% |
| Immigrants | Laos | 21.5 /100 | #198 | Fair 79.4% |
| Dutch | 20.2 /100 | #199 | Fair 79.3% |
| Immigrants | Oceania | 19.1 /100 | #200 | Poor 79.3% |
| Immigrants | Nicaragua | 19.0 /100 | #201 | Poor 79.3% |
| Nicaraguans | 18.3 /100 | #202 | Poor 79.3% |
| Iraqis | 17.7 /100 | #203 | Poor 79.3% |
| Immigrants | Cambodia | 17.6 /100 | #204 | Poor 79.3% |
| Immigrants | Congo | 17.5 /100 | #205 | Poor 79.3% |
Demographics Similar to Scotch-Irish by In Labor Force | Age 20-64
In terms of in labor force | age 20-64, the demographic groups most similar to Scotch-Irish are Immigrants from Barbados (78.3%, a difference of 0.020%), Immigrants from Latin America (78.3%, a difference of 0.020%), Marshallese (78.3%, a difference of 0.020%), French American Indian (78.2%, a difference of 0.070%), and West Indian (78.3%, a difference of 0.080%).
| Demographics | Rating | Rank | In Labor Force | Age 20-64 |
| Pennsylvania Germans | 0.1 /100 | #263 | Tragic 78.4% |
| Spaniards | 0.1 /100 | #264 | Tragic 78.4% |
| British West Indians | 0.1 /100 | #265 | Tragic 78.4% |
| Bahamians | 0.1 /100 | #266 | Tragic 78.4% |
| U.S. Virgin Islanders | 0.1 /100 | #267 | Tragic 78.4% |
| West Indians | 0.0 /100 | #268 | Tragic 78.3% |
| Immigrants | Barbados | 0.0 /100 | #269 | Tragic 78.3% |
| Scotch-Irish | 0.0 /100 | #270 | Tragic 78.3% |
| Immigrants | Latin America | 0.0 /100 | #271 | Tragic 78.3% |
| Marshallese | 0.0 /100 | #272 | Tragic 78.3% |
| French American Indians | 0.0 /100 | #273 | Tragic 78.2% |
| Aleuts | 0.0 /100 | #274 | Tragic 78.2% |
| Spanish | 0.0 /100 | #275 | Tragic 78.2% |
| Puget Sound Salish | 0.0 /100 | #276 | Tragic 78.2% |
| Immigrants | Bahamas | 0.0 /100 | #277 | Tragic 78.2% |