Bhutanese vs Scotch-Irish In Labor Force | Age 20-64
COMPARE
Bhutanese
Scotch-Irish
In Labor Force | Age 20-64
In Labor Force | Age 20-64 Comparison
Bhutanese
Scotch-Irish
80.2%
IN LABOR FORCE | AGE 20-64
98.6/ 100
METRIC RATING
68th/ 347
METRIC RANK
78.3%
IN LABOR FORCE | AGE 20-64
0.0/ 100
METRIC RATING
270th/ 347
METRIC RANK
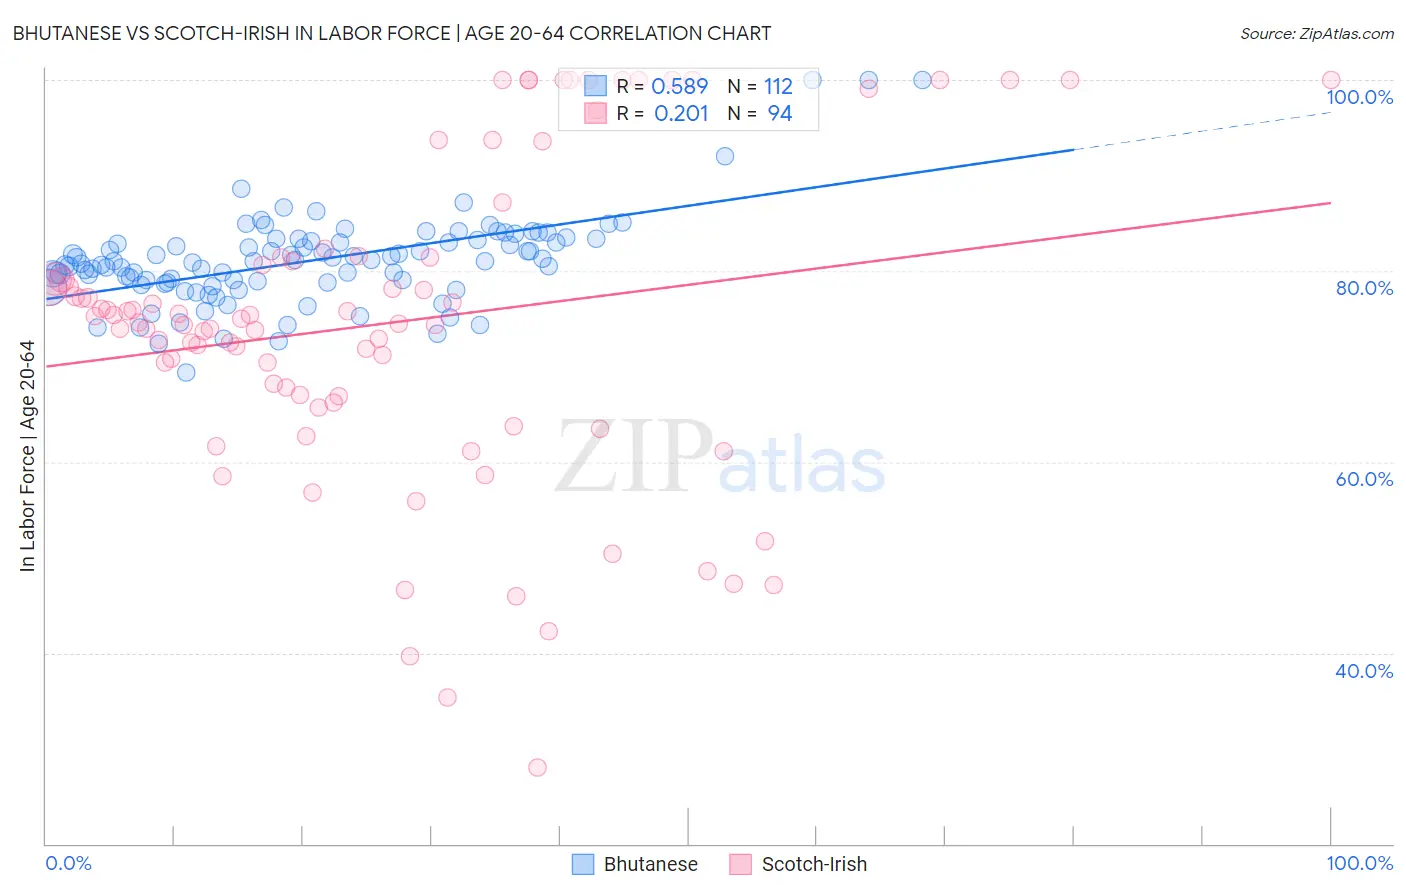
Bhutanese vs Scotch-Irish In Labor Force | Age 20-64 Correlation Chart
The statistical analysis conducted on geographies consisting of 455,602,654 people shows a substantial positive correlation between the proportion of Bhutanese and labor force participation rate among population between the ages 20 and 64 in the United States with a correlation coefficient (R) of 0.589 and weighted average of 80.2%. Similarly, the statistical analysis conducted on geographies consisting of 548,766,362 people shows a weak positive correlation between the proportion of Scotch-Irish and labor force participation rate among population between the ages 20 and 64 in the United States with a correlation coefficient (R) of 0.201 and weighted average of 78.3%, a difference of 2.5%.
In Labor Force | Age 20-64 Correlation Summary
| Measurement | Bhutanese | Scotch-Irish |
| Minimum | 69.3% | 28.0% |
| Maximum | 100.0% | 100.0% |
| Range | 30.7% | 72.0% |
| Mean | 81.1% | 74.6% |
| Median | 81.0% | 74.8% |
| Interquartile 25% (IQ1) | 78.8% | 66.9% |
| Interquartile 75% (IQ3) | 83.2% | 81.3% |
| Interquartile Range (IQR) | 4.3% | 14.5% |
| Standard Deviation (Sample) | 4.8% | 16.5% |
| Standard Deviation (Population) | 4.8% | 16.4% |
Similar Demographics by In Labor Force | Age 20-64
Demographics Similar to Bhutanese by In Labor Force | Age 20-64
In terms of in labor force | age 20-64, the demographic groups most similar to Bhutanese are Albanian (80.2%, a difference of 0.0%), Immigrants from Turkey (80.2%, a difference of 0.0%), Macedonian (80.2%, a difference of 0.010%), Taiwanese (80.2%, a difference of 0.010%), and Soviet Union (80.2%, a difference of 0.010%).
| Demographics | Rating | Rank | In Labor Force | Age 20-64 |
| Burmese | 98.8 /100 | #61 | Exceptional 80.3% |
| Carpatho Rusyns | 98.8 /100 | #62 | Exceptional 80.3% |
| Immigrants | Korea | 98.8 /100 | #63 | Exceptional 80.3% |
| Immigrants | Albania | 98.7 /100 | #64 | Exceptional 80.3% |
| Lithuanians | 98.7 /100 | #65 | Exceptional 80.2% |
| Macedonians | 98.7 /100 | #66 | Exceptional 80.2% |
| Taiwanese | 98.6 /100 | #67 | Exceptional 80.2% |
| Bhutanese | 98.6 /100 | #68 | Exceptional 80.2% |
| Albanians | 98.6 /100 | #69 | Exceptional 80.2% |
| Immigrants | Turkey | 98.5 /100 | #70 | Exceptional 80.2% |
| Soviet Union | 98.5 /100 | #71 | Exceptional 80.2% |
| Eastern Europeans | 98.4 /100 | #72 | Exceptional 80.2% |
| Cypriots | 98.2 /100 | #73 | Exceptional 80.2% |
| Immigrants | Eastern Europe | 98.1 /100 | #74 | Exceptional 80.2% |
| Immigrants | Afghanistan | 97.9 /100 | #75 | Exceptional 80.2% |
Demographics Similar to Scotch-Irish by In Labor Force | Age 20-64
In terms of in labor force | age 20-64, the demographic groups most similar to Scotch-Irish are Immigrants from Barbados (78.3%, a difference of 0.020%), Immigrants from Latin America (78.3%, a difference of 0.020%), Marshallese (78.3%, a difference of 0.020%), French American Indian (78.2%, a difference of 0.070%), and West Indian (78.3%, a difference of 0.080%).
| Demographics | Rating | Rank | In Labor Force | Age 20-64 |
| Pennsylvania Germans | 0.1 /100 | #263 | Tragic 78.4% |
| Spaniards | 0.1 /100 | #264 | Tragic 78.4% |
| British West Indians | 0.1 /100 | #265 | Tragic 78.4% |
| Bahamians | 0.1 /100 | #266 | Tragic 78.4% |
| U.S. Virgin Islanders | 0.1 /100 | #267 | Tragic 78.4% |
| West Indians | 0.0 /100 | #268 | Tragic 78.3% |
| Immigrants | Barbados | 0.0 /100 | #269 | Tragic 78.3% |
| Scotch-Irish | 0.0 /100 | #270 | Tragic 78.3% |
| Immigrants | Latin America | 0.0 /100 | #271 | Tragic 78.3% |
| Marshallese | 0.0 /100 | #272 | Tragic 78.3% |
| French American Indians | 0.0 /100 | #273 | Tragic 78.2% |
| Aleuts | 0.0 /100 | #274 | Tragic 78.2% |
| Spanish | 0.0 /100 | #275 | Tragic 78.2% |
| Puget Sound Salish | 0.0 /100 | #276 | Tragic 78.2% |
| Immigrants | Bahamas | 0.0 /100 | #277 | Tragic 78.2% |