Immigrants from Caribbean vs Polish In Labor Force | Age 25-29
COMPARE
Immigrants from Caribbean
Polish
In Labor Force | Age 25-29
In Labor Force | Age 25-29 Comparison
Immigrants from Caribbean
Poles
83.4%
IN LABOR FORCE | AGE 25-29
0.0/ 100
METRIC RATING
272nd/ 347
METRIC RANK
85.8%
IN LABOR FORCE | AGE 25-29
99.9/ 100
METRIC RATING
37th/ 347
METRIC RANK
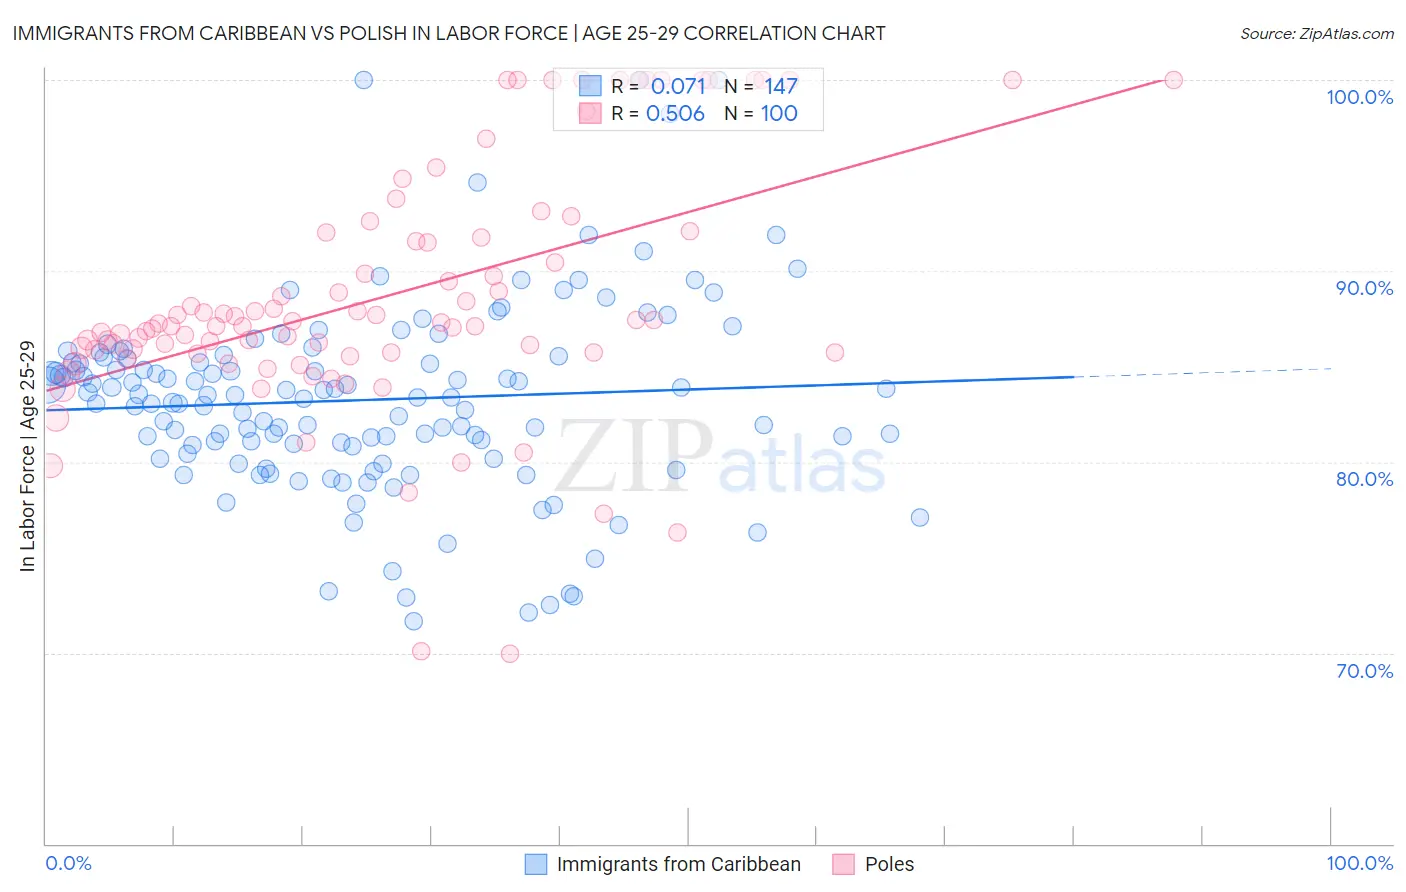
Immigrants from Caribbean vs Polish In Labor Force | Age 25-29 Correlation Chart
The statistical analysis conducted on geographies consisting of 449,813,481 people shows a slight positive correlation between the proportion of Immigrants from Caribbean and labor force participation rate among population between the ages 25 and 29 in the United States with a correlation coefficient (R) of 0.071 and weighted average of 83.4%. Similarly, the statistical analysis conducted on geographies consisting of 559,462,142 people shows a substantial positive correlation between the proportion of Poles and labor force participation rate among population between the ages 25 and 29 in the United States with a correlation coefficient (R) of 0.506 and weighted average of 85.8%, a difference of 2.9%.
In Labor Force | Age 25-29 Correlation Summary
| Measurement | Immigrants from Caribbean | Polish |
| Minimum | 71.7% | 69.9% |
| Maximum | 100.0% | 100.0% |
| Range | 28.3% | 30.1% |
| Mean | 83.2% | 88.7% |
| Median | 83.4% | 87.2% |
| Interquartile 25% (IQ1) | 80.8% | 85.7% |
| Interquartile 75% (IQ3) | 85.5% | 91.9% |
| Interquartile Range (IQR) | 4.7% | 6.2% |
| Standard Deviation (Sample) | 5.0% | 6.4% |
| Standard Deviation (Population) | 5.0% | 6.4% |
Similar Demographics by In Labor Force | Age 25-29
Demographics Similar to Immigrants from Caribbean by In Labor Force | Age 25-29
In terms of in labor force | age 25-29, the demographic groups most similar to Immigrants from Caribbean are Immigrants from Dominica (83.4%, a difference of 0.0%), Honduran (83.4%, a difference of 0.030%), Marshallese (83.3%, a difference of 0.030%), Basque (83.4%, a difference of 0.050%), and Immigrants from Lebanon (83.4%, a difference of 0.070%).
| Demographics | Rating | Rank | In Labor Force | Age 25-29 |
| Cubans | 0.1 /100 | #265 | Tragic 83.5% |
| Aleuts | 0.0 /100 | #266 | Tragic 83.4% |
| Spanish Americans | 0.0 /100 | #267 | Tragic 83.4% |
| Immigrants | Lebanon | 0.0 /100 | #268 | Tragic 83.4% |
| Immigrants | Barbados | 0.0 /100 | #269 | Tragic 83.4% |
| Basques | 0.0 /100 | #270 | Tragic 83.4% |
| Hondurans | 0.0 /100 | #271 | Tragic 83.4% |
| Immigrants | Caribbean | 0.0 /100 | #272 | Tragic 83.4% |
| Immigrants | Dominica | 0.0 /100 | #273 | Tragic 83.4% |
| Marshallese | 0.0 /100 | #274 | Tragic 83.3% |
| Samoans | 0.0 /100 | #275 | Tragic 83.3% |
| Immigrants | Honduras | 0.0 /100 | #276 | Tragic 83.3% |
| Africans | 0.0 /100 | #277 | Tragic 83.2% |
| Immigrants | Cuba | 0.0 /100 | #278 | Tragic 83.2% |
| British West Indians | 0.0 /100 | #279 | Tragic 83.2% |
Demographics Similar to Poles by In Labor Force | Age 25-29
In terms of in labor force | age 25-29, the demographic groups most similar to Poles are Sierra Leonean (85.8%, a difference of 0.020%), Cypriot (85.8%, a difference of 0.030%), Immigrants from Nepal (85.8%, a difference of 0.030%), Croatian (85.8%, a difference of 0.030%), and Lithuanian (85.8%, a difference of 0.040%).
| Demographics | Rating | Rank | In Labor Force | Age 25-29 |
| Immigrants | Serbia | 100.0 /100 | #30 | Exceptional 85.9% |
| German Russians | 100.0 /100 | #31 | Exceptional 85.8% |
| Slovaks | 100.0 /100 | #32 | Exceptional 85.8% |
| Immigrants | Bulgaria | 100.0 /100 | #33 | Exceptional 85.8% |
| Lithuanians | 99.9 /100 | #34 | Exceptional 85.8% |
| Cypriots | 99.9 /100 | #35 | Exceptional 85.8% |
| Immigrants | Nepal | 99.9 /100 | #36 | Exceptional 85.8% |
| Poles | 99.9 /100 | #37 | Exceptional 85.8% |
| Sierra Leoneans | 99.9 /100 | #38 | Exceptional 85.8% |
| Croatians | 99.9 /100 | #39 | Exceptional 85.8% |
| Immigrants | Albania | 99.9 /100 | #40 | Exceptional 85.7% |
| Immigrants | Greece | 99.9 /100 | #41 | Exceptional 85.7% |
| Immigrants | Eritrea | 99.9 /100 | #42 | Exceptional 85.7% |
| Immigrants | India | 99.9 /100 | #43 | Exceptional 85.7% |
| Macedonians | 99.9 /100 | #44 | Exceptional 85.7% |