Immigrants from Romania vs Polish In Labor Force | Age 25-29
COMPARE
Immigrants from Romania
Polish
In Labor Force | Age 25-29
In Labor Force | Age 25-29 Comparison
Immigrants from Romania
Poles
85.1%
IN LABOR FORCE | AGE 25-29
94.6/ 100
METRIC RATING
96th/ 347
METRIC RANK
85.8%
IN LABOR FORCE | AGE 25-29
99.9/ 100
METRIC RATING
37th/ 347
METRIC RANK
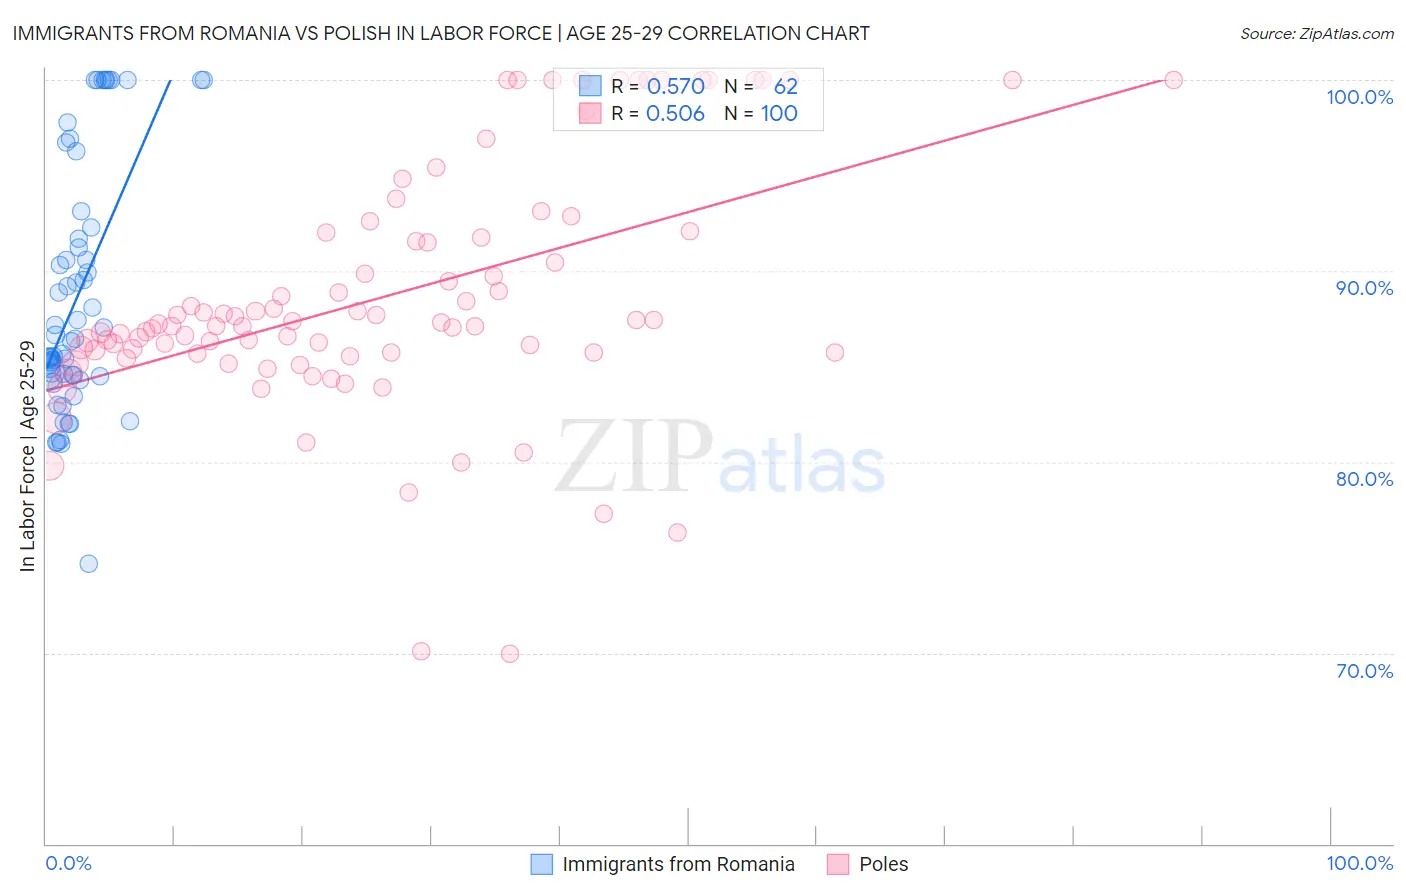
Immigrants from Romania vs Polish In Labor Force | Age 25-29 Correlation Chart
The statistical analysis conducted on geographies consisting of 256,997,701 people shows a substantial positive correlation between the proportion of Immigrants from Romania and labor force participation rate among population between the ages 25 and 29 in the United States with a correlation coefficient (R) of 0.570 and weighted average of 85.1%. Similarly, the statistical analysis conducted on geographies consisting of 559,462,142 people shows a substantial positive correlation between the proportion of Poles and labor force participation rate among population between the ages 25 and 29 in the United States with a correlation coefficient (R) of 0.506 and weighted average of 85.8%, a difference of 0.80%.
In Labor Force | Age 25-29 Correlation Summary
| Measurement | Immigrants from Romania | Polish |
| Minimum | 74.7% | 69.9% |
| Maximum | 100.0% | 100.0% |
| Range | 25.3% | 30.1% |
| Mean | 88.8% | 88.7% |
| Median | 86.5% | 87.2% |
| Interquartile 25% (IQ1) | 84.5% | 85.7% |
| Interquartile 75% (IQ3) | 92.3% | 91.9% |
| Interquartile Range (IQR) | 7.8% | 6.2% |
| Standard Deviation (Sample) | 6.5% | 6.4% |
| Standard Deviation (Population) | 6.4% | 6.4% |
Similar Demographics by In Labor Force | Age 25-29
Demographics Similar to Immigrants from Romania by In Labor Force | Age 25-29
In terms of in labor force | age 25-29, the demographic groups most similar to Immigrants from Romania are Immigrants from Netherlands (85.1%, a difference of 0.0%), Immigrants from Korea (85.1%, a difference of 0.010%), Immigrants from Sudan (85.1%, a difference of 0.010%), Mongolian (85.1%, a difference of 0.020%), and Bangladeshi (85.1%, a difference of 0.020%).
| Demographics | Rating | Rank | In Labor Force | Age 25-29 |
| Immigrants | France | 96.3 /100 | #89 | Exceptional 85.2% |
| Burmese | 95.9 /100 | #90 | Exceptional 85.1% |
| Immigrants | Moldova | 95.8 /100 | #91 | Exceptional 85.1% |
| Immigrants | Costa Rica | 95.5 /100 | #92 | Exceptional 85.1% |
| Austrians | 95.3 /100 | #93 | Exceptional 85.1% |
| Immigrants | Korea | 94.8 /100 | #94 | Exceptional 85.1% |
| Immigrants | Netherlands | 94.6 /100 | #95 | Exceptional 85.1% |
| Immigrants | Romania | 94.6 /100 | #96 | Exceptional 85.1% |
| Immigrants | Sudan | 94.3 /100 | #97 | Exceptional 85.1% |
| Mongolians | 94.1 /100 | #98 | Exceptional 85.1% |
| Bangladeshis | 94.0 /100 | #99 | Exceptional 85.1% |
| Immigrants | Switzerland | 93.9 /100 | #100 | Exceptional 85.1% |
| Egyptians | 93.8 /100 | #101 | Exceptional 85.1% |
| Slavs | 93.7 /100 | #102 | Exceptional 85.1% |
| Immigrants | Japan | 93.5 /100 | #103 | Exceptional 85.1% |
Demographics Similar to Poles by In Labor Force | Age 25-29
In terms of in labor force | age 25-29, the demographic groups most similar to Poles are Sierra Leonean (85.8%, a difference of 0.020%), Cypriot (85.8%, a difference of 0.030%), Immigrants from Nepal (85.8%, a difference of 0.030%), Croatian (85.8%, a difference of 0.030%), and Lithuanian (85.8%, a difference of 0.040%).
| Demographics | Rating | Rank | In Labor Force | Age 25-29 |
| Immigrants | Serbia | 100.0 /100 | #30 | Exceptional 85.9% |
| German Russians | 100.0 /100 | #31 | Exceptional 85.8% |
| Slovaks | 100.0 /100 | #32 | Exceptional 85.8% |
| Immigrants | Bulgaria | 100.0 /100 | #33 | Exceptional 85.8% |
| Lithuanians | 99.9 /100 | #34 | Exceptional 85.8% |
| Cypriots | 99.9 /100 | #35 | Exceptional 85.8% |
| Immigrants | Nepal | 99.9 /100 | #36 | Exceptional 85.8% |
| Poles | 99.9 /100 | #37 | Exceptional 85.8% |
| Sierra Leoneans | 99.9 /100 | #38 | Exceptional 85.8% |
| Croatians | 99.9 /100 | #39 | Exceptional 85.8% |
| Immigrants | Albania | 99.9 /100 | #40 | Exceptional 85.7% |
| Immigrants | Greece | 99.9 /100 | #41 | Exceptional 85.7% |
| Immigrants | Eritrea | 99.9 /100 | #42 | Exceptional 85.7% |
| Immigrants | India | 99.9 /100 | #43 | Exceptional 85.7% |
| Macedonians | 99.9 /100 | #44 | Exceptional 85.7% |