Hispanic or Latino vs Comanche In Labor Force | Age 20-24
COMPARE
Hispanic or Latino
Comanche
In Labor Force | Age 20-24
In Labor Force | Age 20-24 Comparison
Hispanics or Latinos
Comanche
74.4%
IN LABOR FORCE | AGE 20-24
7.9/ 100
METRIC RATING
223rd/ 347
METRIC RANK
75.4%
IN LABOR FORCE | AGE 20-24
77.6/ 100
METRIC RATING
147th/ 347
METRIC RANK
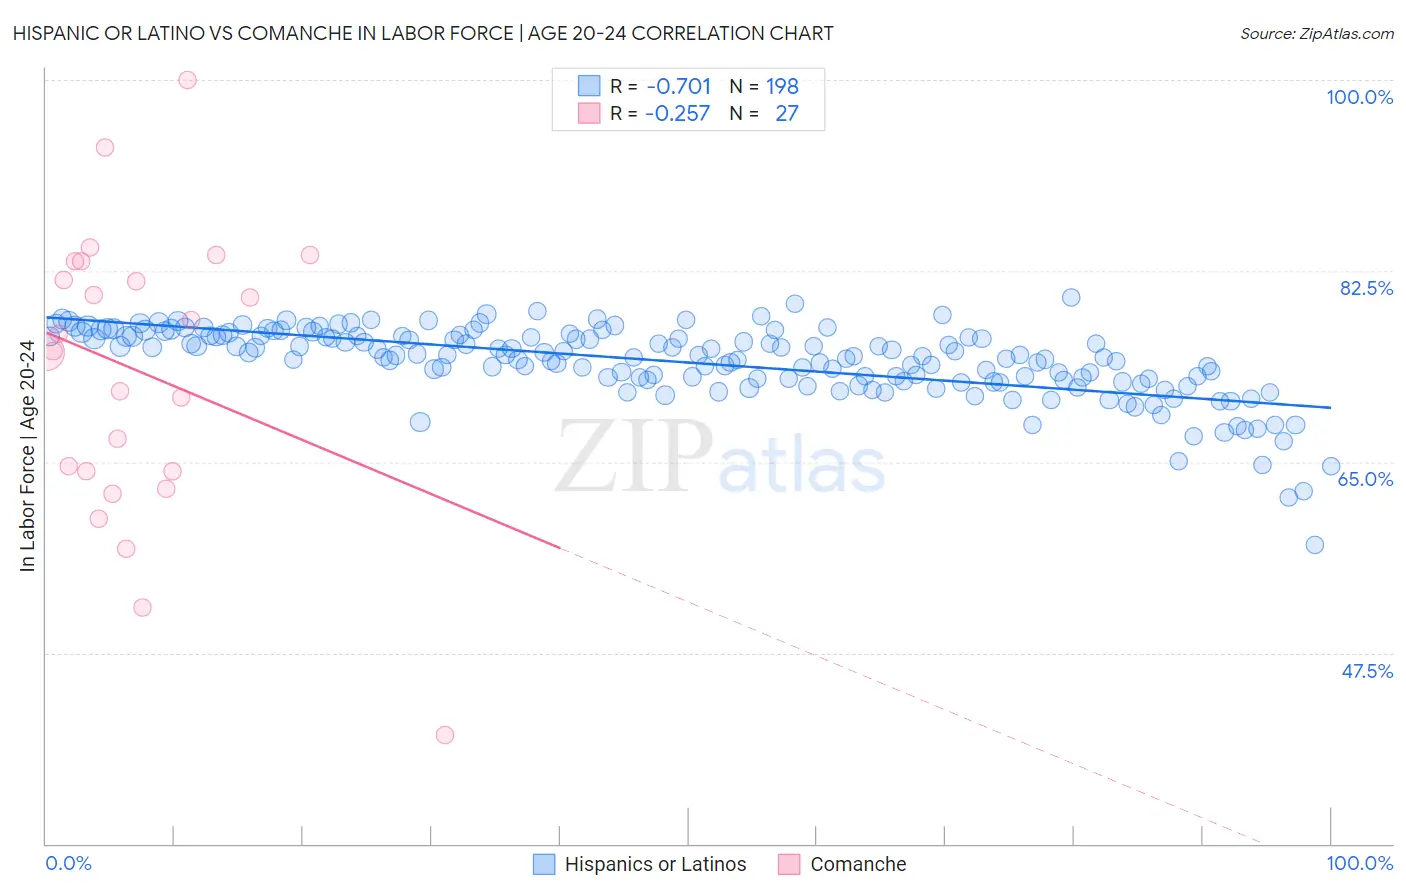
Hispanic or Latino vs Comanche In Labor Force | Age 20-24 Correlation Chart
The statistical analysis conducted on geographies consisting of 573,599,041 people shows a strong negative correlation between the proportion of Hispanics or Latinos and labor force participation rate among population between the ages 20 and 24 in the United States with a correlation coefficient (R) of -0.701 and weighted average of 74.4%. Similarly, the statistical analysis conducted on geographies consisting of 109,763,066 people shows a weak negative correlation between the proportion of Comanche and labor force participation rate among population between the ages 20 and 24 in the United States with a correlation coefficient (R) of -0.257 and weighted average of 75.4%, a difference of 1.4%.
In Labor Force | Age 20-24 Correlation Summary
| Measurement | Hispanic or Latino | Comanche |
| Minimum | 57.4% | 40.0% |
| Maximum | 80.0% | 100.0% |
| Range | 22.7% | 60.0% |
| Mean | 74.1% | 73.2% |
| Median | 74.8% | 75.1% |
| Interquartile 25% (IQ1) | 72.6% | 64.1% |
| Interquartile 75% (IQ3) | 76.6% | 83.4% |
| Interquartile Range (IQR) | 4.0% | 19.3% |
| Standard Deviation (Sample) | 3.4% | 13.2% |
| Standard Deviation (Population) | 3.4% | 12.9% |
Similar Demographics by In Labor Force | Age 20-24
Demographics Similar to Hispanics or Latinos by In Labor Force | Age 20-24
In terms of in labor force | age 20-24, the demographic groups most similar to Hispanics or Latinos are Seminole (74.3%, a difference of 0.060%), Immigrants from India (74.4%, a difference of 0.090%), Chickasaw (74.5%, a difference of 0.10%), Ghanaian (74.3%, a difference of 0.10%), and Immigrants from Norway (74.5%, a difference of 0.11%).
| Demographics | Rating | Rank | In Labor Force | Age 20-24 |
| Immigrants | Kuwait | 12.7 /100 | #216 | Poor 74.5% |
| Chileans | 12.5 /100 | #217 | Poor 74.5% |
| Immigrants | Peru | 10.6 /100 | #218 | Poor 74.5% |
| Nepalese | 10.5 /100 | #219 | Poor 74.5% |
| Immigrants | Norway | 10.3 /100 | #220 | Poor 74.5% |
| Chickasaw | 10.3 /100 | #221 | Poor 74.5% |
| Immigrants | India | 9.9 /100 | #222 | Tragic 74.4% |
| Hispanics or Latinos | 7.9 /100 | #223 | Tragic 74.4% |
| Seminole | 6.9 /100 | #224 | Tragic 74.3% |
| Ghanaians | 6.2 /100 | #225 | Tragic 74.3% |
| Immigrants | Fiji | 5.9 /100 | #226 | Tragic 74.3% |
| Immigrants | Ireland | 5.8 /100 | #227 | Tragic 74.3% |
| Immigrants | Ukraine | 5.1 /100 | #228 | Tragic 74.2% |
| Immigrants | Sweden | 4.6 /100 | #229 | Tragic 74.2% |
| Immigrants | Albania | 4.3 /100 | #230 | Tragic 74.2% |
Demographics Similar to Comanche by In Labor Force | Age 20-24
In terms of in labor force | age 20-24, the demographic groups most similar to Comanche are Immigrants from Cambodia (75.4%, a difference of 0.020%), Mexican American Indian (75.4%, a difference of 0.030%), Ugandan (75.4%, a difference of 0.030%), Korean (75.4%, a difference of 0.050%), and Salvadoran (75.3%, a difference of 0.050%).
| Demographics | Rating | Rank | In Labor Force | Age 20-24 |
| Delaware | 84.5 /100 | #140 | Excellent 75.5% |
| Romanians | 84.1 /100 | #141 | Excellent 75.5% |
| Blackfeet | 83.6 /100 | #142 | Excellent 75.5% |
| Spaniards | 82.0 /100 | #143 | Excellent 75.5% |
| Bhutanese | 80.8 /100 | #144 | Excellent 75.4% |
| Koreans | 79.7 /100 | #145 | Good 75.4% |
| Mexican American Indians | 78.8 /100 | #146 | Good 75.4% |
| Comanche | 77.6 /100 | #147 | Good 75.4% |
| Immigrants | Cambodia | 76.7 /100 | #148 | Good 75.4% |
| Ugandans | 76.1 /100 | #149 | Good 75.4% |
| Salvadorans | 74.8 /100 | #150 | Good 75.3% |
| Paiute | 74.1 /100 | #151 | Good 75.3% |
| Lebanese | 73.5 /100 | #152 | Good 75.3% |
| Guatemalans | 72.3 /100 | #153 | Good 75.3% |
| Osage | 72.3 /100 | #154 | Good 75.3% |