Immigrants from Cabo Verde vs Ecuadorian In Labor Force | Age 20-64
COMPARE
Immigrants from Cabo Verde
Ecuadorian
In Labor Force | Age 20-64
In Labor Force | Age 20-64 Comparison
Immigrants from Cabo Verde
Ecuadorians
80.3%
IN LABOR FORCE | AGE 20-64
99.0/ 100
METRIC RATING
55th/ 347
METRIC RANK
79.4%
IN LABOR FORCE | AGE 20-64
23.1/ 100
METRIC RATING
196th/ 347
METRIC RANK
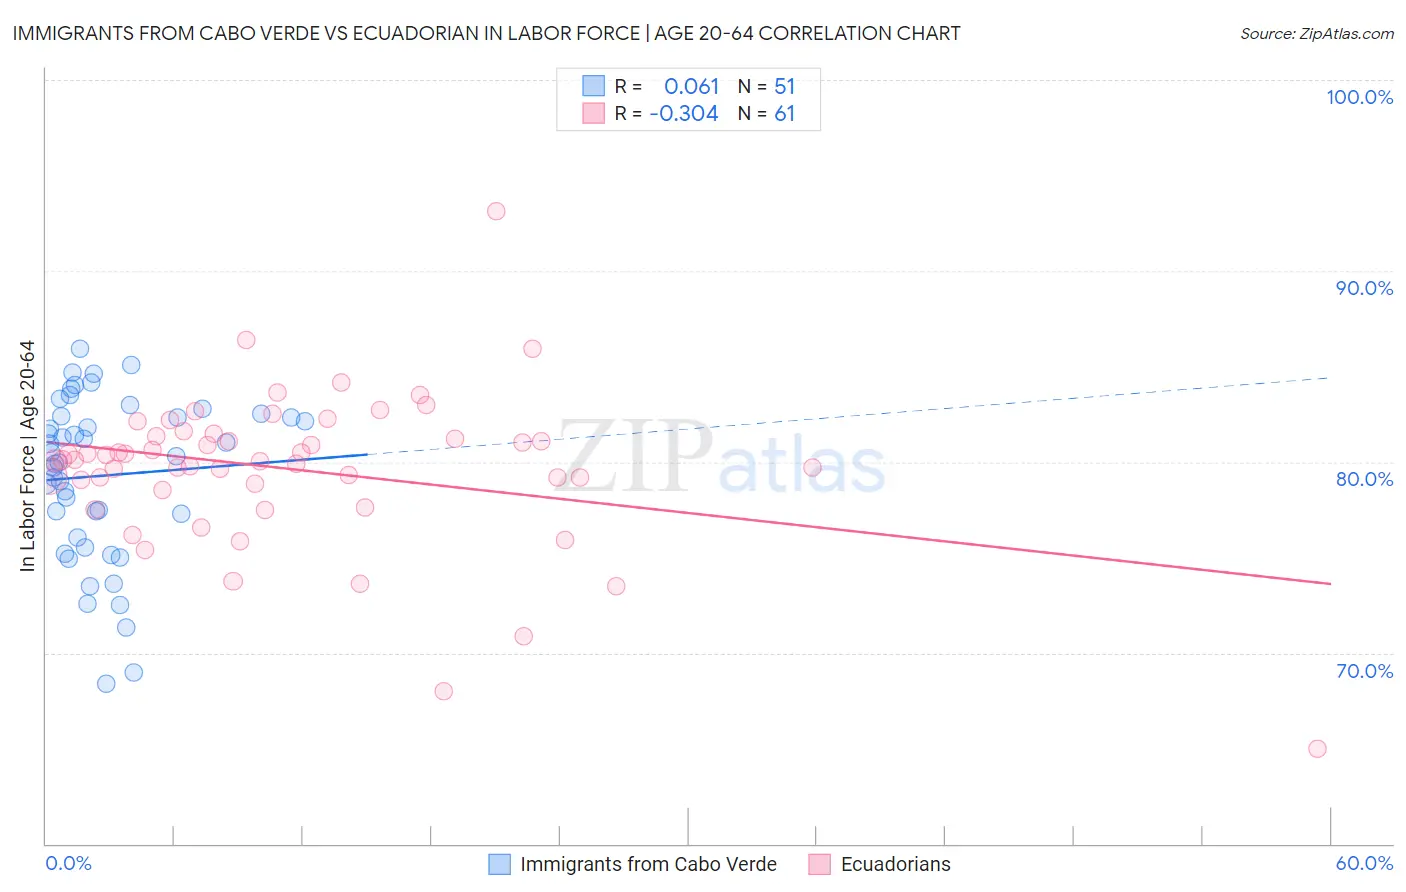
Immigrants from Cabo Verde vs Ecuadorian In Labor Force | Age 20-64 Correlation Chart
The statistical analysis conducted on geographies consisting of 38,158,316 people shows a slight positive correlation between the proportion of Immigrants from Cabo Verde and labor force participation rate among population between the ages 20 and 64 in the United States with a correlation coefficient (R) of 0.061 and weighted average of 80.3%. Similarly, the statistical analysis conducted on geographies consisting of 317,839,465 people shows a mild negative correlation between the proportion of Ecuadorians and labor force participation rate among population between the ages 20 and 64 in the United States with a correlation coefficient (R) of -0.304 and weighted average of 79.4%, a difference of 1.2%.
In Labor Force | Age 20-64 Correlation Summary
| Measurement | Immigrants from Cabo Verde | Ecuadorian |
| Minimum | 68.4% | 65.0% |
| Maximum | 85.9% | 93.1% |
| Range | 17.5% | 28.1% |
| Mean | 79.3% | 79.6% |
| Median | 80.3% | 80.1% |
| Interquartile 25% (IQ1) | 76.0% | 78.7% |
| Interquartile 75% (IQ3) | 82.4% | 81.4% |
| Interquartile Range (IQR) | 6.4% | 2.7% |
| Standard Deviation (Sample) | 4.3% | 4.1% |
| Standard Deviation (Population) | 4.2% | 4.1% |
Similar Demographics by In Labor Force | Age 20-64
Demographics Similar to Immigrants from Cabo Verde by In Labor Force | Age 20-64
In terms of in labor force | age 20-64, the demographic groups most similar to Immigrants from Cabo Verde are Immigrants from Northern Africa (80.3%, a difference of 0.010%), Afghan (80.3%, a difference of 0.010%), Peruvian (80.3%, a difference of 0.020%), Serbian (80.3%, a difference of 0.030%), and Swedish (80.3%, a difference of 0.030%).
| Demographics | Rating | Rank | In Labor Force | Age 20-64 |
| Immigrants | Hong Kong | 99.5 /100 | #48 | Exceptional 80.4% |
| Immigrants | Greece | 99.4 /100 | #49 | Exceptional 80.4% |
| Immigrants | Sudan | 99.4 /100 | #50 | Exceptional 80.4% |
| Immigrants | Sri Lanka | 99.3 /100 | #51 | Exceptional 80.4% |
| Turks | 99.2 /100 | #52 | Exceptional 80.3% |
| Immigrants | Peru | 99.2 /100 | #53 | Exceptional 80.3% |
| Peruvians | 99.1 /100 | #54 | Exceptional 80.3% |
| Immigrants | Cabo Verde | 99.0 /100 | #55 | Exceptional 80.3% |
| Immigrants | Northern Africa | 99.0 /100 | #56 | Exceptional 80.3% |
| Afghans | 98.9 /100 | #57 | Exceptional 80.3% |
| Serbians | 98.9 /100 | #58 | Exceptional 80.3% |
| Swedes | 98.9 /100 | #59 | Exceptional 80.3% |
| Tongans | 98.8 /100 | #60 | Exceptional 80.3% |
| Burmese | 98.8 /100 | #61 | Exceptional 80.3% |
| Carpatho Rusyns | 98.8 /100 | #62 | Exceptional 80.3% |
Demographics Similar to Ecuadorians by In Labor Force | Age 20-64
In terms of in labor force | age 20-64, the demographic groups most similar to Ecuadorians are Immigrants from Austria (79.4%, a difference of 0.010%), Immigrants from Senegal (79.4%, a difference of 0.010%), Immigrants from Thailand (79.4%, a difference of 0.020%), Immigrants from Laos (79.4%, a difference of 0.020%), and Indonesian (79.4%, a difference of 0.030%).
| Demographics | Rating | Rank | In Labor Force | Age 20-64 |
| Immigrants | El Salvador | 30.9 /100 | #189 | Fair 79.4% |
| Immigrants | Syria | 30.8 /100 | #190 | Fair 79.4% |
| Swiss | 28.9 /100 | #191 | Fair 79.4% |
| Immigrants | Denmark | 26.9 /100 | #192 | Fair 79.4% |
| Indonesians | 26.1 /100 | #193 | Fair 79.4% |
| Immigrants | Thailand | 24.8 /100 | #194 | Fair 79.4% |
| Immigrants | Austria | 23.7 /100 | #195 | Fair 79.4% |
| Ecuadorians | 23.1 /100 | #196 | Fair 79.4% |
| Immigrants | Senegal | 22.5 /100 | #197 | Fair 79.4% |
| Immigrants | Laos | 21.5 /100 | #198 | Fair 79.4% |
| Dutch | 20.2 /100 | #199 | Fair 79.3% |
| Immigrants | Oceania | 19.1 /100 | #200 | Poor 79.3% |
| Immigrants | Nicaragua | 19.0 /100 | #201 | Poor 79.3% |
| Nicaraguans | 18.3 /100 | #202 | Poor 79.3% |
| Iraqis | 17.7 /100 | #203 | Poor 79.3% |