Hispanic or Latino vs Argentinean Family Households with Children
COMPARE
Hispanic or Latino
Argentinean
Family Households with Children
Family Households with Children Comparison
Hispanics or Latinos
Argentineans
29.9%
FAMILY HOUSEHOLDS WITH CHILDREN
100.0/ 100
METRIC RATING
17th/ 347
METRIC RANK
27.6%
FAMILY HOUSEHOLDS WITH CHILDREN
78.5/ 100
METRIC RATING
150th/ 347
METRIC RANK
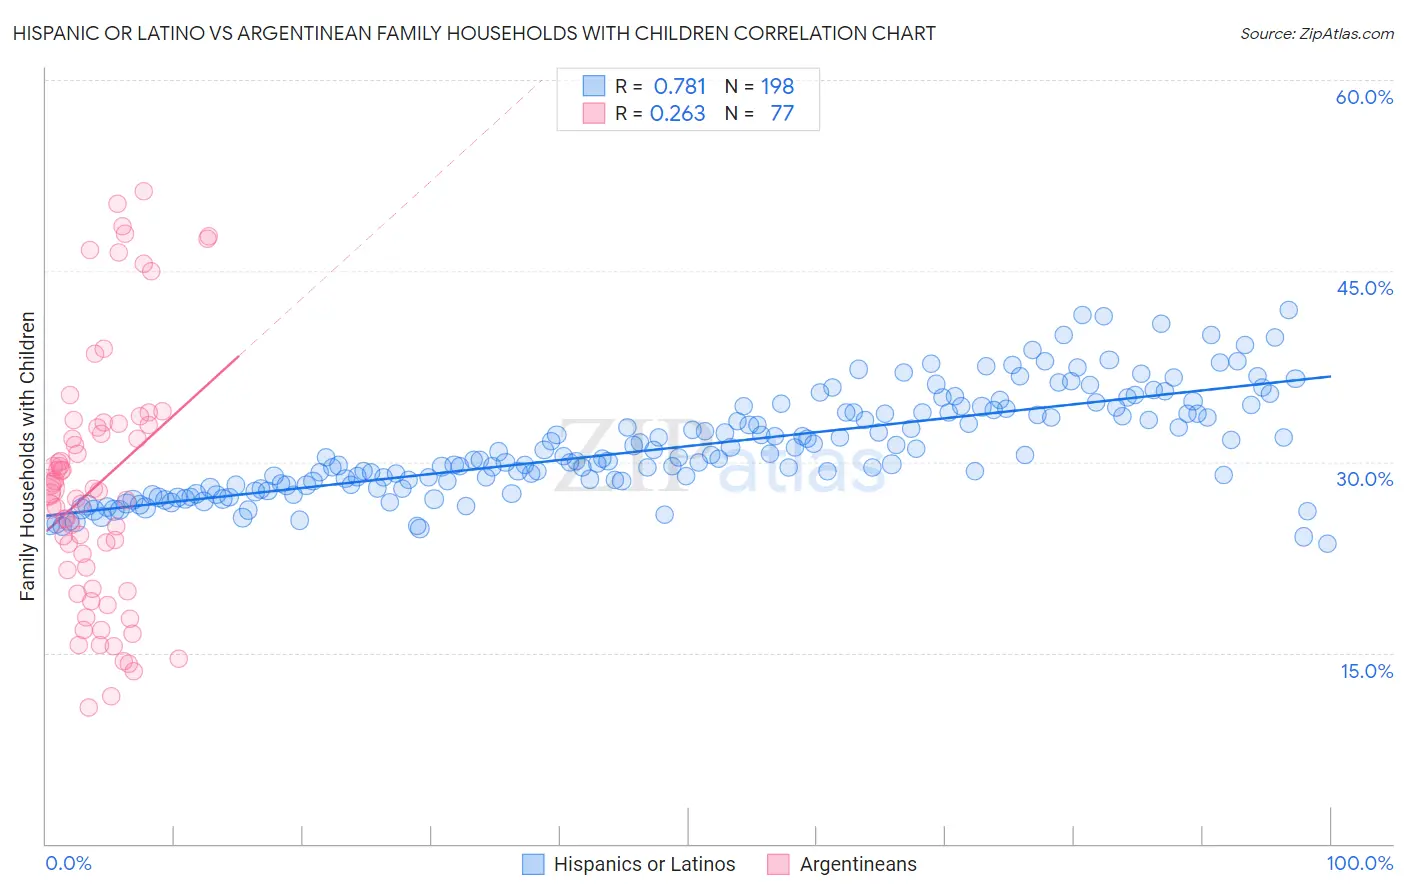
Hispanic or Latino vs Argentinean Family Households with Children Correlation Chart
The statistical analysis conducted on geographies consisting of 574,333,059 people shows a strong positive correlation between the proportion of Hispanics or Latinos and percentage of family households with children in the United States with a correlation coefficient (R) of 0.781 and weighted average of 29.9%. Similarly, the statistical analysis conducted on geographies consisting of 296,871,630 people shows a weak positive correlation between the proportion of Argentineans and percentage of family households with children in the United States with a correlation coefficient (R) of 0.263 and weighted average of 27.6%, a difference of 8.2%.
Family Households with Children Correlation Summary
| Measurement | Hispanic or Latino | Argentinean |
| Minimum | 23.6% | 10.7% |
| Maximum | 41.9% | 51.3% |
| Range | 18.3% | 40.6% |
| Mean | 31.2% | 28.2% |
| Median | 30.3% | 27.7% |
| Interquartile 25% (IQ1) | 28.2% | 20.8% |
| Interquartile 75% (IQ3) | 33.9% | 32.9% |
| Interquartile Range (IQR) | 5.8% | 12.1% |
| Standard Deviation (Sample) | 4.0% | 9.9% |
| Standard Deviation (Population) | 4.0% | 9.9% |
Similar Demographics by Family Households with Children
Demographics Similar to Hispanics or Latinos by Family Households with Children
In terms of family households with children, the demographic groups most similar to Hispanics or Latinos are Salvadoran (29.9%, a difference of 0.19%), Alaska Native (29.9%, a difference of 0.22%), Immigrants from El Salvador (29.8%, a difference of 0.25%), Immigrants from Laos (29.8%, a difference of 0.30%), and Malaysian (29.8%, a difference of 0.33%).
| Demographics | Rating | Rank | Family Households with Children |
| Immigrants | Fiji | 100.0 /100 | #10 | Exceptional 30.5% |
| Nepalese | 100.0 /100 | #11 | Exceptional 30.5% |
| Immigrants | Pakistan | 100.0 /100 | #12 | Exceptional 30.2% |
| Afghans | 100.0 /100 | #13 | Exceptional 30.2% |
| Bangladeshis | 100.0 /100 | #14 | Exceptional 30.1% |
| Immigrants | South Central Asia | 100.0 /100 | #15 | Exceptional 30.0% |
| Immigrants | Afghanistan | 100.0 /100 | #16 | Exceptional 30.0% |
| Hispanics or Latinos | 100.0 /100 | #17 | Exceptional 29.9% |
| Salvadorans | 100.0 /100 | #18 | Exceptional 29.9% |
| Alaska Natives | 100.0 /100 | #19 | Exceptional 29.9% |
| Immigrants | El Salvador | 100.0 /100 | #20 | Exceptional 29.8% |
| Immigrants | Laos | 100.0 /100 | #21 | Exceptional 29.8% |
| Malaysians | 100.0 /100 | #22 | Exceptional 29.8% |
| Mexican American Indians | 100.0 /100 | #23 | Exceptional 29.7% |
| Guamanians/Chamorros | 100.0 /100 | #24 | Exceptional 29.7% |
Demographics Similar to Argentineans by Family Households with Children
In terms of family households with children, the demographic groups most similar to Argentineans are Menominee (27.6%, a difference of 0.010%), Immigrants from Moldova (27.6%, a difference of 0.020%), Osage (27.6%, a difference of 0.020%), Portuguese (27.6%, a difference of 0.020%), and Immigrants from Chile (27.7%, a difference of 0.030%).
| Demographics | Rating | Rank | Family Households with Children |
| Immigrants | Eastern Africa | 80.2 /100 | #143 | Excellent 27.7% |
| Brazilians | 79.6 /100 | #144 | Good 27.7% |
| Immigrants | Chile | 79.5 /100 | #145 | Good 27.7% |
| Basques | 79.5 /100 | #146 | Good 27.7% |
| Immigrants | Moldova | 79.1 /100 | #147 | Good 27.6% |
| Osage | 79.0 /100 | #148 | Good 27.6% |
| Menominee | 78.9 /100 | #149 | Good 27.6% |
| Argentineans | 78.5 /100 | #150 | Good 27.6% |
| Portuguese | 77.8 /100 | #151 | Good 27.6% |
| Ethiopians | 77.0 /100 | #152 | Good 27.6% |
| Immigrants | Cabo Verde | 75.6 /100 | #153 | Good 27.6% |
| Icelanders | 75.3 /100 | #154 | Good 27.6% |
| Comanche | 74.8 /100 | #155 | Good 27.6% |
| Hungarians | 74.6 /100 | #156 | Good 27.6% |
| Indians (Asian) | 71.6 /100 | #157 | Good 27.6% |