Soviet Union vs Immigrants from Thailand In Labor Force | Age > 16
COMPARE
Soviet Union
Immigrants from Thailand
In Labor Force | Age > 16
In Labor Force | Age > 16 Comparison
Soviet Union
Immigrants from Thailand
65.0%
IN LABOR FORCE | AGE > 16
40.5/ 100
METRIC RATING
183rd/ 347
METRIC RANK
65.7%
IN LABOR FORCE | AGE > 16
96.6/ 100
METRIC RATING
118th/ 347
METRIC RANK
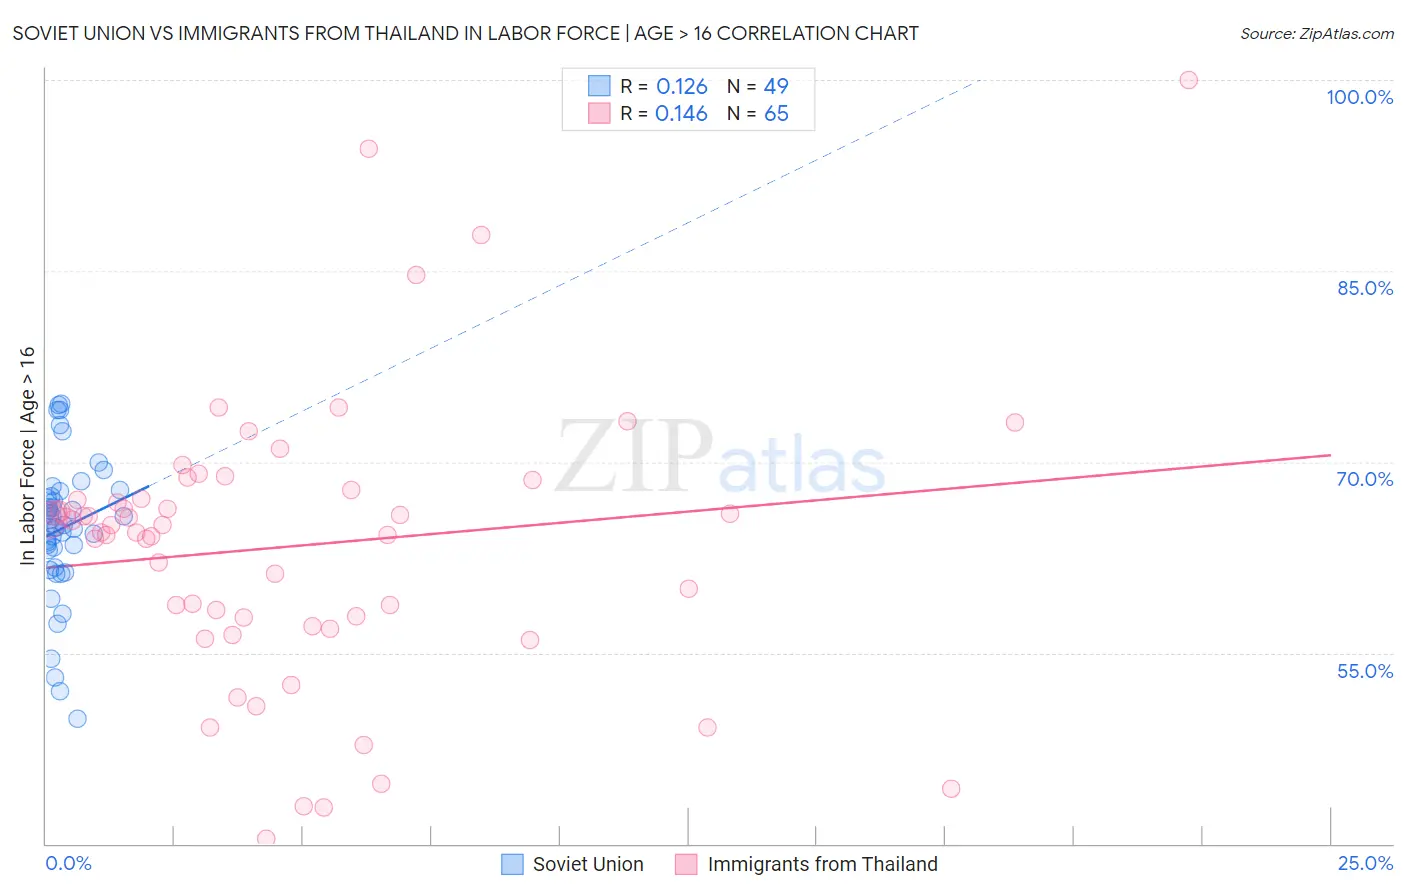
Soviet Union vs Immigrants from Thailand In Labor Force | Age > 16 Correlation Chart
The statistical analysis conducted on geographies consisting of 43,504,651 people shows a poor positive correlation between the proportion of Soviet Union and labor force participation rate among population ages 16 and over in the United States with a correlation coefficient (R) of 0.126 and weighted average of 65.0%. Similarly, the statistical analysis conducted on geographies consisting of 317,023,360 people shows a poor positive correlation between the proportion of Immigrants from Thailand and labor force participation rate among population ages 16 and over in the United States with a correlation coefficient (R) of 0.146 and weighted average of 65.7%, a difference of 1.1%.
In Labor Force | Age > 16 Correlation Summary
| Measurement | Soviet Union | Immigrants from Thailand |
| Minimum | 49.8% | 40.4% |
| Maximum | 74.6% | 100.0% |
| Range | 24.8% | 59.6% |
| Mean | 64.8% | 63.4% |
| Median | 65.1% | 65.1% |
| Interquartile 25% (IQ1) | 62.4% | 57.4% |
| Interquartile 75% (IQ3) | 67.5% | 67.5% |
| Interquartile Range (IQR) | 5.1% | 10.1% |
| Standard Deviation (Sample) | 5.5% | 11.0% |
| Standard Deviation (Population) | 5.4% | 11.0% |
Similar Demographics by In Labor Force | Age > 16
Demographics Similar to Soviet Union by In Labor Force | Age > 16
In terms of in labor force | age > 16, the demographic groups most similar to Soviet Union are Immigrants from Nicaragua (65.1%, a difference of 0.010%), Carpatho Rusyn (65.0%, a difference of 0.010%), Syrian (65.0%, a difference of 0.010%), Immigrants from Panama (65.1%, a difference of 0.020%), and Immigrants from Haiti (65.1%, a difference of 0.030%).
| Demographics | Rating | Rank | In Labor Force | Age > 16 |
| Swedes | 47.4 /100 | #176 | Average 65.1% |
| Eastern Europeans | 46.2 /100 | #177 | Average 65.1% |
| Trinidadians and Tobagonians | 45.2 /100 | #178 | Average 65.1% |
| Immigrants | Haiti | 43.3 /100 | #179 | Average 65.1% |
| Immigrants | Latvia | 42.9 /100 | #180 | Average 65.1% |
| Immigrants | Panama | 42.4 /100 | #181 | Average 65.1% |
| Immigrants | Nicaragua | 41.1 /100 | #182 | Average 65.1% |
| Soviet Union | 40.5 /100 | #183 | Average 65.0% |
| Carpatho Rusyns | 40.0 /100 | #184 | Average 65.0% |
| Syrians | 40.0 /100 | #185 | Average 65.0% |
| Immigrants | Switzerland | 38.2 /100 | #186 | Fair 65.0% |
| Immigrants | Croatia | 35.7 /100 | #187 | Fair 65.0% |
| Immigrants | Portugal | 34.8 /100 | #188 | Fair 65.0% |
| Immigrants | Greece | 34.3 /100 | #189 | Fair 65.0% |
| Barbadians | 33.9 /100 | #190 | Fair 65.0% |
Demographics Similar to Immigrants from Thailand by In Labor Force | Age > 16
In terms of in labor force | age > 16, the demographic groups most similar to Immigrants from Thailand are Immigrants from Iran (65.7%, a difference of 0.0%), Argentinean (65.7%, a difference of 0.010%), Immigrants from France (65.7%, a difference of 0.010%), Immigrants from Indonesia (65.7%, a difference of 0.020%), and Immigrants from Hong Kong (65.7%, a difference of 0.030%).
| Demographics | Rating | Rank | In Labor Force | Age > 16 |
| Immigrants | Honduras | 97.5 /100 | #111 | Exceptional 65.8% |
| Laotians | 97.4 /100 | #112 | Exceptional 65.8% |
| Pakistanis | 97.1 /100 | #113 | Exceptional 65.8% |
| Hondurans | 97.1 /100 | #114 | Exceptional 65.8% |
| Immigrants | Indonesia | 96.8 /100 | #115 | Exceptional 65.7% |
| Argentineans | 96.7 /100 | #116 | Exceptional 65.7% |
| Immigrants | Iran | 96.6 /100 | #117 | Exceptional 65.7% |
| Immigrants | Thailand | 96.6 /100 | #118 | Exceptional 65.7% |
| Immigrants | France | 96.4 /100 | #119 | Exceptional 65.7% |
| Immigrants | Hong Kong | 96.2 /100 | #120 | Exceptional 65.7% |
| New Zealanders | 96.0 /100 | #121 | Exceptional 65.7% |
| Immigrants | Ecuador | 95.9 /100 | #122 | Exceptional 65.7% |
| Immigrants | Iraq | 95.5 /100 | #123 | Exceptional 65.7% |
| Iraqis | 95.4 /100 | #124 | Exceptional 65.7% |
| Norwegians | 95.3 /100 | #125 | Exceptional 65.7% |