Guyanese vs Immigrants from Thailand Disability Age Under 5
COMPARE
Guyanese
Immigrants from Thailand
Disability Age Under 5
Disability Age Under 5 Comparison
Guyanese
Immigrants from Thailand
1.0%
DISABILITY AGE UNDER 5
100.0/ 100
METRIC RATING
27th/ 347
METRIC RANK
1.2%
DISABILITY AGE UNDER 5
69.4/ 100
METRIC RATING
153rd/ 347
METRIC RANK
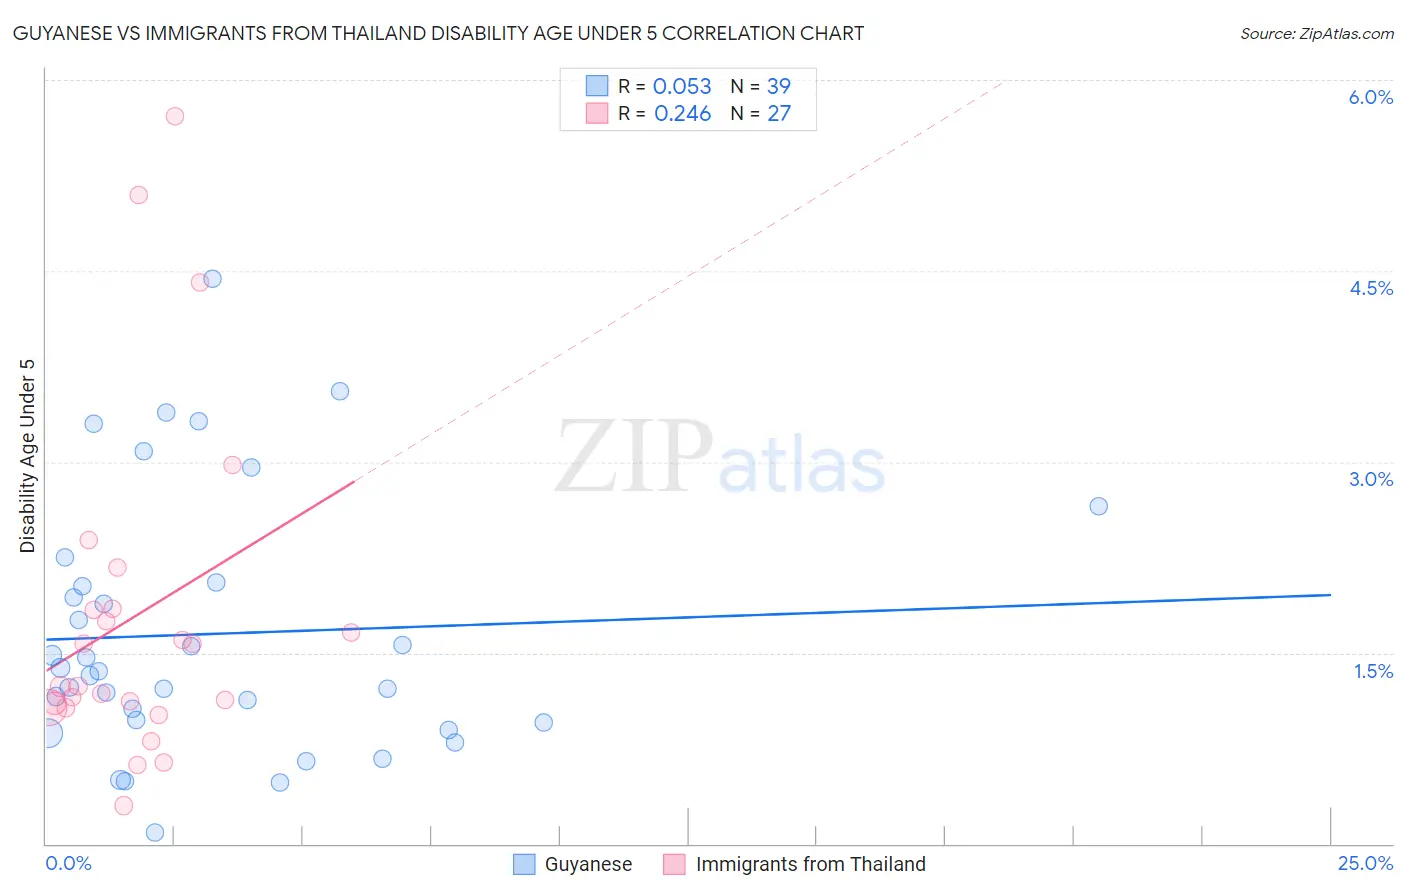
Guyanese vs Immigrants from Thailand Disability Age Under 5 Correlation Chart
The statistical analysis conducted on geographies consisting of 114,513,627 people shows a slight positive correlation between the proportion of Guyanese and percentage of population with a disability under the age of 5 in the United States with a correlation coefficient (R) of 0.053 and weighted average of 1.0%. Similarly, the statistical analysis conducted on geographies consisting of 187,942,657 people shows a weak positive correlation between the proportion of Immigrants from Thailand and percentage of population with a disability under the age of 5 in the United States with a correlation coefficient (R) of 0.246 and weighted average of 1.2%, a difference of 19.9%.
Disability Age Under 5 Correlation Summary
| Measurement | Guyanese | Immigrants from Thailand |
| Minimum | 0.086% | 0.30% |
| Maximum | 4.4% | 5.7% |
| Range | 4.4% | 5.4% |
| Mean | 1.6% | 1.8% |
| Median | 1.4% | 1.2% |
| Interquartile 25% (IQ1) | 0.95% | 1.1% |
| Interquartile 75% (IQ3) | 2.1% | 1.9% |
| Interquartile Range (IQR) | 1.1% | 0.78% |
| Standard Deviation (Sample) | 1.0% | 1.3% |
| Standard Deviation (Population) | 1.00% | 1.3% |
Similar Demographics by Disability Age Under 5
Demographics Similar to Guyanese by Disability Age Under 5
In terms of disability age under 5, the demographic groups most similar to Guyanese are Immigrants from Eastern Asia (1.0%, a difference of 0.63%), Immigrants from Belarus (1.0%, a difference of 0.76%), Immigrants from Taiwan (1.0%, a difference of 0.84%), Immigrants from Micronesia (1.0%, a difference of 0.97%), and Indian (Asian) (1.0%, a difference of 1.3%).
| Demographics | Rating | Rank | Disability Age Under 5 |
| Nepalese | 100.0 /100 | #20 | Exceptional 0.97% |
| British West Indians | 100.0 /100 | #21 | Exceptional 0.99% |
| Immigrants | Iran | 100.0 /100 | #22 | Exceptional 1.00% |
| Yakama | 100.0 /100 | #23 | Exceptional 1.00% |
| Indians (Asian) | 100.0 /100 | #24 | Exceptional 1.0% |
| Immigrants | Micronesia | 100.0 /100 | #25 | Exceptional 1.0% |
| Immigrants | Taiwan | 100.0 /100 | #26 | Exceptional 1.0% |
| Guyanese | 100.0 /100 | #27 | Exceptional 1.0% |
| Immigrants | Eastern Asia | 100.0 /100 | #28 | Exceptional 1.0% |
| Immigrants | Belarus | 100.0 /100 | #29 | Exceptional 1.0% |
| Immigrants | South Central Asia | 99.9 /100 | #30 | Exceptional 1.0% |
| Armenians | 99.9 /100 | #31 | Exceptional 1.0% |
| Iranians | 99.9 /100 | #32 | Exceptional 1.0% |
| Bolivians | 99.9 /100 | #33 | Exceptional 1.0% |
| Immigrants | Ukraine | 99.9 /100 | #34 | Exceptional 1.0% |
Demographics Similar to Immigrants from Thailand by Disability Age Under 5
In terms of disability age under 5, the demographic groups most similar to Immigrants from Thailand are Uruguayan (1.2%, a difference of 0.070%), Immigrants from Ghana (1.2%, a difference of 0.080%), Hawaiian (1.2%, a difference of 0.10%), Immigrants from South America (1.2%, a difference of 0.26%), and Arab (1.2%, a difference of 0.32%).
| Demographics | Rating | Rank | Disability Age Under 5 |
| Samoans | 77.7 /100 | #146 | Good 1.2% |
| Icelanders | 76.3 /100 | #147 | Good 1.2% |
| Ghanaians | 76.3 /100 | #148 | Good 1.2% |
| Kenyans | 75.9 /100 | #149 | Good 1.2% |
| South Americans | 75.6 /100 | #150 | Good 1.2% |
| Yaqui | 74.8 /100 | #151 | Good 1.2% |
| Hondurans | 72.5 /100 | #152 | Good 1.2% |
| Immigrants | Thailand | 69.4 /100 | #153 | Good 1.2% |
| Uruguayans | 68.8 /100 | #154 | Good 1.2% |
| Immigrants | Ghana | 68.7 /100 | #155 | Good 1.2% |
| Hawaiians | 68.5 /100 | #156 | Good 1.2% |
| Immigrants | South America | 67.0 /100 | #157 | Good 1.2% |
| Arabs | 66.4 /100 | #158 | Good 1.2% |
| Colombians | 65.8 /100 | #159 | Good 1.2% |
| Immigrants | Latin America | 65.8 /100 | #160 | Good 1.2% |