Cajun vs Immigrants from Thailand In Labor Force | Age > 16
COMPARE
Cajun
Immigrants from Thailand
In Labor Force | Age > 16
In Labor Force | Age > 16 Comparison
Cajuns
Immigrants from Thailand
61.8%
IN LABOR FORCE | AGE > 16
0.0/ 100
METRIC RATING
327th/ 347
METRIC RANK
65.7%
IN LABOR FORCE | AGE > 16
96.6/ 100
METRIC RATING
118th/ 347
METRIC RANK
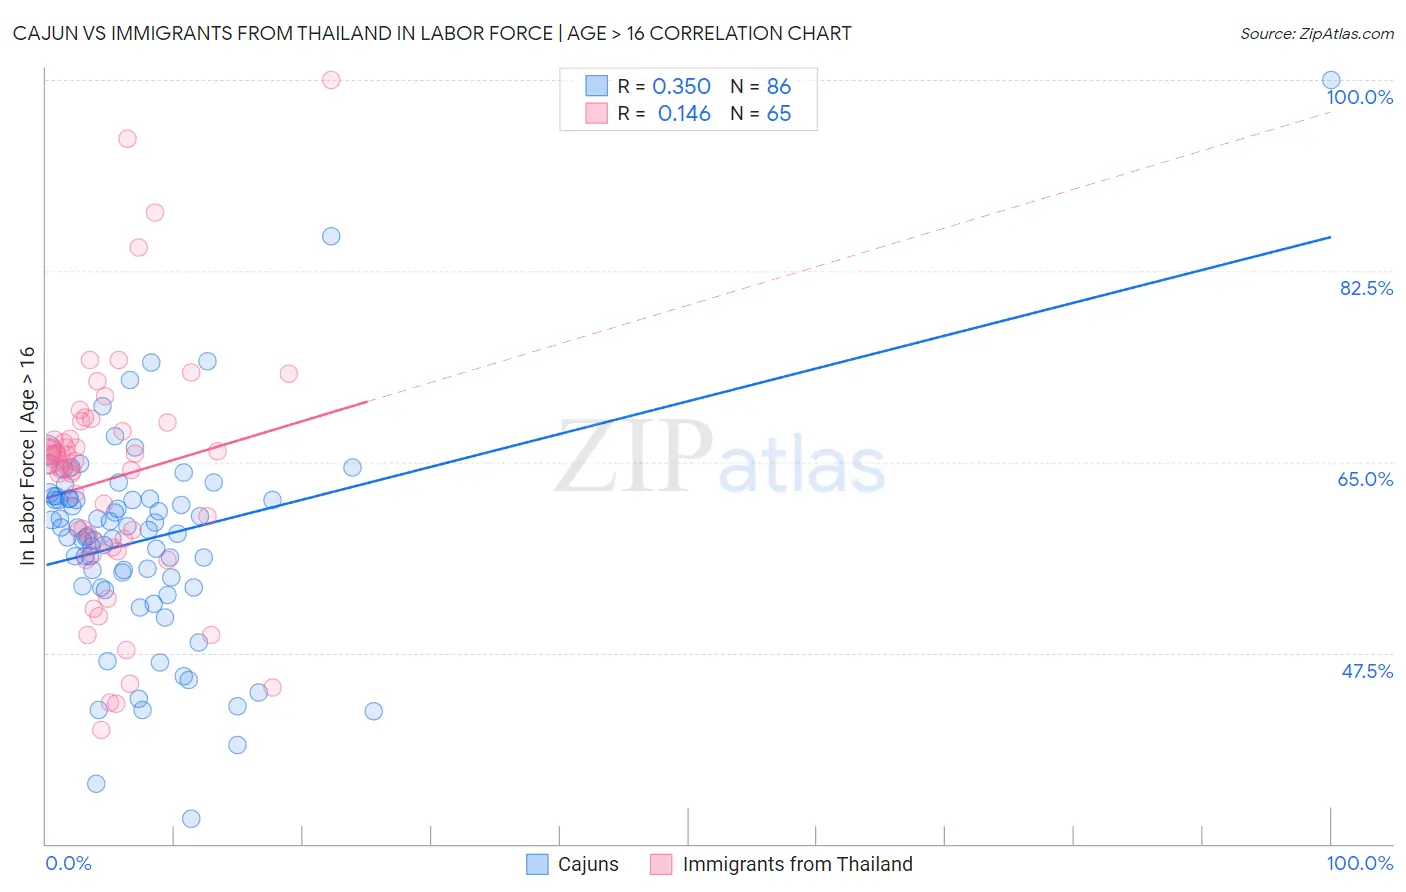
Cajun vs Immigrants from Thailand In Labor Force | Age > 16 Correlation Chart
The statistical analysis conducted on geographies consisting of 149,712,932 people shows a mild positive correlation between the proportion of Cajuns and labor force participation rate among population ages 16 and over in the United States with a correlation coefficient (R) of 0.350 and weighted average of 61.8%. Similarly, the statistical analysis conducted on geographies consisting of 317,023,360 people shows a poor positive correlation between the proportion of Immigrants from Thailand and labor force participation rate among population ages 16 and over in the United States with a correlation coefficient (R) of 0.146 and weighted average of 65.7%, a difference of 6.4%.
In Labor Force | Age > 16 Correlation Summary
| Measurement | Cajun | Immigrants from Thailand |
| Minimum | 32.3% | 40.4% |
| Maximum | 100.0% | 100.0% |
| Range | 67.7% | 59.6% |
| Mean | 57.9% | 63.4% |
| Median | 58.9% | 65.1% |
| Interquartile 25% (IQ1) | 53.6% | 57.4% |
| Interquartile 75% (IQ3) | 61.6% | 67.5% |
| Interquartile Range (IQR) | 8.0% | 10.1% |
| Standard Deviation (Sample) | 9.7% | 11.0% |
| Standard Deviation (Population) | 9.7% | 11.0% |
Similar Demographics by In Labor Force | Age > 16
Demographics Similar to Cajuns by In Labor Force | Age > 16
In terms of in labor force | age > 16, the demographic groups most similar to Cajuns are Sioux (61.8%, a difference of 0.11%), Dutch West Indian (61.7%, a difference of 0.16%), Cherokee (61.9%, a difference of 0.29%), Cheyenne (62.0%, a difference of 0.34%), and Seminole (62.0%, a difference of 0.38%).
| Demographics | Rating | Rank | In Labor Force | Age > 16 |
| Yakama | 0.0 /100 | #320 | Tragic 62.1% |
| Americans | 0.0 /100 | #321 | Tragic 62.1% |
| Ottawa | 0.0 /100 | #322 | Tragic 62.0% |
| Seminole | 0.0 /100 | #323 | Tragic 62.0% |
| Cheyenne | 0.0 /100 | #324 | Tragic 62.0% |
| Cherokee | 0.0 /100 | #325 | Tragic 61.9% |
| Sioux | 0.0 /100 | #326 | Tragic 61.8% |
| Cajuns | 0.0 /100 | #327 | Tragic 61.8% |
| Dutch West Indians | 0.0 /100 | #328 | Tragic 61.7% |
| Choctaw | 0.0 /100 | #329 | Tragic 61.5% |
| Creek | 0.0 /100 | #330 | Tragic 61.3% |
| Ute | 0.0 /100 | #331 | Tragic 60.9% |
| Crow | 0.0 /100 | #332 | Tragic 60.8% |
| Paiute | 0.0 /100 | #333 | Tragic 60.7% |
| Apache | 0.0 /100 | #334 | Tragic 60.7% |
Demographics Similar to Immigrants from Thailand by In Labor Force | Age > 16
In terms of in labor force | age > 16, the demographic groups most similar to Immigrants from Thailand are Immigrants from Iran (65.7%, a difference of 0.0%), Argentinean (65.7%, a difference of 0.010%), Immigrants from France (65.7%, a difference of 0.010%), Immigrants from Indonesia (65.7%, a difference of 0.020%), and Immigrants from Hong Kong (65.7%, a difference of 0.030%).
| Demographics | Rating | Rank | In Labor Force | Age > 16 |
| Immigrants | Honduras | 97.5 /100 | #111 | Exceptional 65.8% |
| Laotians | 97.4 /100 | #112 | Exceptional 65.8% |
| Pakistanis | 97.1 /100 | #113 | Exceptional 65.8% |
| Hondurans | 97.1 /100 | #114 | Exceptional 65.8% |
| Immigrants | Indonesia | 96.8 /100 | #115 | Exceptional 65.7% |
| Argentineans | 96.7 /100 | #116 | Exceptional 65.7% |
| Immigrants | Iran | 96.6 /100 | #117 | Exceptional 65.7% |
| Immigrants | Thailand | 96.6 /100 | #118 | Exceptional 65.7% |
| Immigrants | France | 96.4 /100 | #119 | Exceptional 65.7% |
| Immigrants | Hong Kong | 96.2 /100 | #120 | Exceptional 65.7% |
| New Zealanders | 96.0 /100 | #121 | Exceptional 65.7% |
| Immigrants | Ecuador | 95.9 /100 | #122 | Exceptional 65.7% |
| Immigrants | Iraq | 95.5 /100 | #123 | Exceptional 65.7% |
| Iraqis | 95.4 /100 | #124 | Exceptional 65.7% |
| Norwegians | 95.3 /100 | #125 | Exceptional 65.7% |