Ecuadorian vs Immigrants from Bolivia In Labor Force | Age 45-54
COMPARE
Ecuadorian
Immigrants from Bolivia
In Labor Force | Age 45-54
In Labor Force | Age 45-54 Comparison
Ecuadorians
Immigrants from Bolivia
82.3%
IN LABOR FORCE | AGE 45-54
6.3/ 100
METRIC RATING
212th/ 347
METRIC RANK
85.3%
IN LABOR FORCE | AGE 45-54
100.0/ 100
METRIC RATING
1st/ 347
METRIC RANK
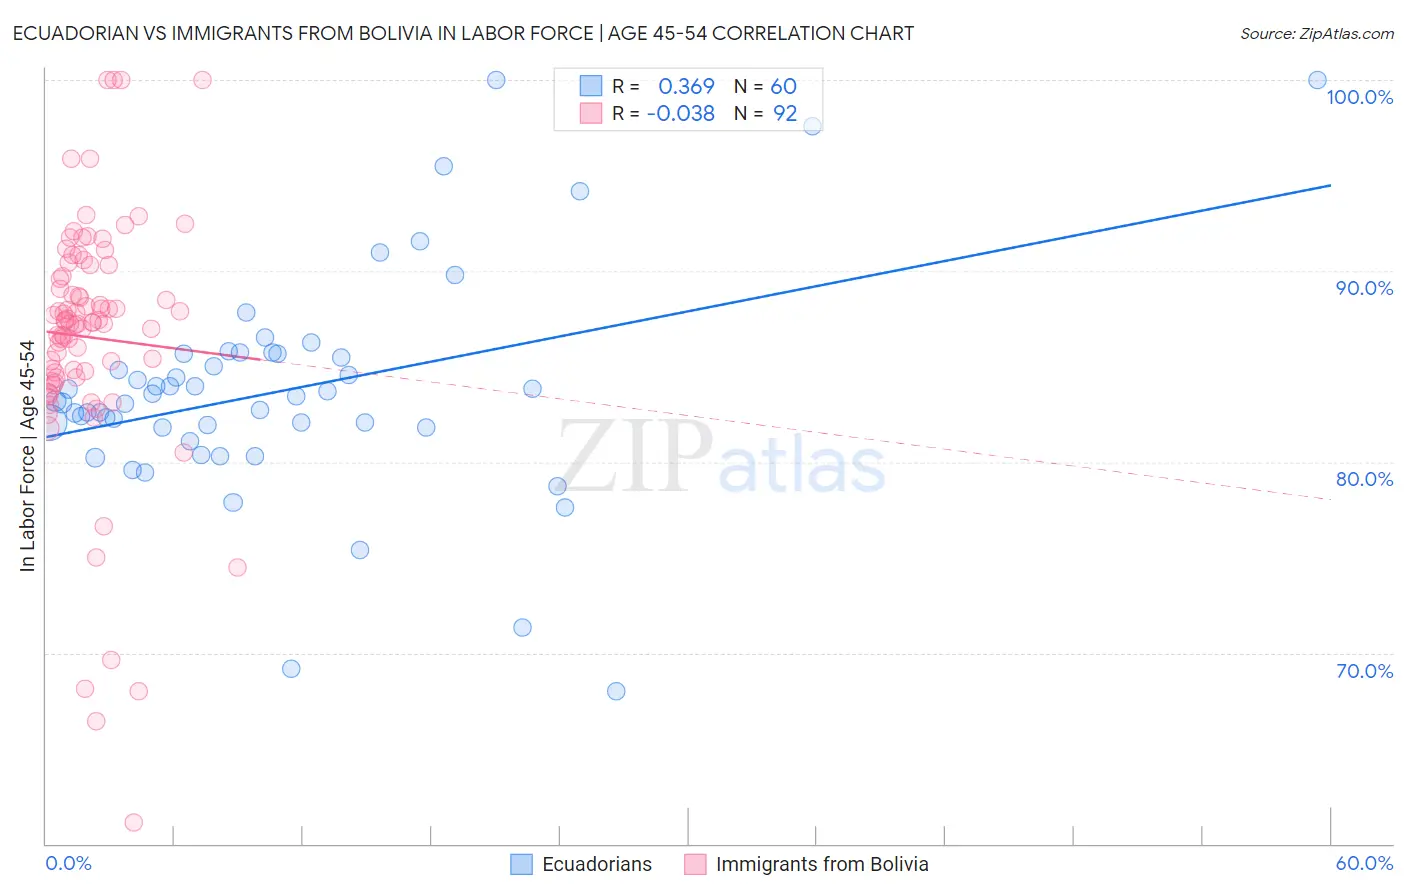
Ecuadorian vs Immigrants from Bolivia In Labor Force | Age 45-54 Correlation Chart
The statistical analysis conducted on geographies consisting of 317,622,832 people shows a mild positive correlation between the proportion of Ecuadorians and labor force participation rate among population between the ages 45 and 54 in the United States with a correlation coefficient (R) of 0.369 and weighted average of 82.3%. Similarly, the statistical analysis conducted on geographies consisting of 158,712,400 people shows no correlation between the proportion of Immigrants from Bolivia and labor force participation rate among population between the ages 45 and 54 in the United States with a correlation coefficient (R) of -0.038 and weighted average of 85.3%, a difference of 3.7%.
In Labor Force | Age 45-54 Correlation Summary
| Measurement | Ecuadorian | Immigrants from Bolivia |
| Minimum | 68.0% | 61.1% |
| Maximum | 100.0% | 100.0% |
| Range | 32.0% | 38.9% |
| Mean | 83.8% | 86.5% |
| Median | 83.3% | 87.3% |
| Interquartile 25% (IQ1) | 81.8% | 84.4% |
| Interquartile 75% (IQ3) | 85.7% | 90.0% |
| Interquartile Range (IQR) | 3.9% | 5.6% |
| Standard Deviation (Sample) | 5.9% | 6.6% |
| Standard Deviation (Population) | 5.9% | 6.6% |
Similar Demographics by In Labor Force | Age 45-54
Demographics Similar to Ecuadorians by In Labor Force | Age 45-54
In terms of in labor force | age 45-54, the demographic groups most similar to Ecuadorians are Immigrants from Syria (82.3%, a difference of 0.010%), Immigrants from Uzbekistan (82.3%, a difference of 0.020%), Immigrants from Bahamas (82.3%, a difference of 0.030%), Immigrants from Panama (82.2%, a difference of 0.030%), and Iraqi (82.2%, a difference of 0.030%).
| Demographics | Rating | Rank | In Labor Force | Age 45-54 |
| Senegalese | 9.5 /100 | #205 | Tragic 82.4% |
| Welsh | 9.2 /100 | #206 | Tragic 82.3% |
| Immigrants | Cabo Verde | 8.6 /100 | #207 | Tragic 82.3% |
| Native Hawaiians | 8.5 /100 | #208 | Tragic 82.3% |
| Immigrants | Lebanon | 7.4 /100 | #209 | Tragic 82.3% |
| Immigrants | Bahamas | 7.1 /100 | #210 | Tragic 82.3% |
| Immigrants | Syria | 6.6 /100 | #211 | Tragic 82.3% |
| Ecuadorians | 6.3 /100 | #212 | Tragic 82.3% |
| Immigrants | Uzbekistan | 5.8 /100 | #213 | Tragic 82.3% |
| Immigrants | Panama | 5.6 /100 | #214 | Tragic 82.2% |
| Iraqis | 5.6 /100 | #215 | Tragic 82.2% |
| Scottish | 5.3 /100 | #216 | Tragic 82.2% |
| Portuguese | 4.7 /100 | #217 | Tragic 82.2% |
| English | 4.4 /100 | #218 | Tragic 82.2% |
| French | 4.1 /100 | #219 | Tragic 82.2% |
Demographics Similar to Immigrants from Bolivia by In Labor Force | Age 45-54
In terms of in labor force | age 45-54, the demographic groups most similar to Immigrants from Bolivia are Luxembourger (85.0%, a difference of 0.34%), Bolivian (84.9%, a difference of 0.43%), Immigrants from Ethiopia (84.8%, a difference of 0.55%), Ethiopian (84.8%, a difference of 0.63%), and Immigrants from India (84.7%, a difference of 0.74%).
| Demographics | Rating | Rank | In Labor Force | Age 45-54 |
| Immigrants | Bolivia | 100.0 /100 | #1 | Exceptional 85.3% |
| Luxembourgers | 100.0 /100 | #2 | Exceptional 85.0% |
| Bolivians | 100.0 /100 | #3 | Exceptional 84.9% |
| Immigrants | Ethiopia | 100.0 /100 | #4 | Exceptional 84.8% |
| Ethiopians | 100.0 /100 | #5 | Exceptional 84.8% |
| Immigrants | India | 100.0 /100 | #6 | Exceptional 84.7% |
| Immigrants | Cameroon | 100.0 /100 | #7 | Exceptional 84.6% |
| Sierra Leoneans | 100.0 /100 | #8 | Exceptional 84.5% |
| Immigrants | Sierra Leone | 100.0 /100 | #9 | Exceptional 84.4% |
| Norwegians | 100.0 /100 | #10 | Exceptional 84.4% |
| Thais | 100.0 /100 | #11 | Exceptional 84.3% |
| Bulgarians | 100.0 /100 | #12 | Exceptional 84.2% |
| Chinese | 99.9 /100 | #13 | Exceptional 84.1% |
| Cambodians | 99.9 /100 | #14 | Exceptional 84.1% |
| Cypriots | 99.9 /100 | #15 | Exceptional 84.1% |