African vs Immigrants from Afghanistan In Labor Force | Age 45-54

COMPARE

African
Race
Ancestry
AfghanAfricanAlaska NativeAlaskan AthabascanAlbanianAleutAlsatianAmericanApacheArabArapahoArgentineanArmenianAssyrian/Chaldean/SyriacAustralianAustrianBahamianBangladeshiBarbadianBasqueBelgianBelizeanBermudanBhutaneseBlackfeetBolivianBrazilianBritishBritish West IndianBulgarianBurmeseCajunCambodianCanadianCape VerdeanCarpatho RusynCelticCentral AmericanCentral American IndianCherokeeCheyenneChickasawChileanChineseChippewaChoctawColombianColvilleComancheCosta RicanCreeCreekCroatianCrowCubanCypriotCzechCzechoslovakianDanishDelawareDominicanDutchDutch West IndianEastern EuropeanEcuadorianEgyptianEnglishEstonianEthiopianEuropeanFijianFilipinoFinnishFrenchFrench American IndianFrench CanadianGermanGerman RussianGhanaianGreekGuamanian/ChamorroGuatemalanGuyaneseHaitianHmongHonduranHopiHoumaHungarianIcelanderIndian (Asian)IndonesianInupiatIranianIraqiIrishIroquoisIsraeliItalianJamaicanJapaneseJordanianKenyanKiowaKoreanLaotianLatvianLebaneseLiberianLithuanianLumbeeLuxembourgerMacedonianMalaysianMalteseMarshalleseMenomineeMexicanMexican American IndianMongolianMoroccanNative HawaiianNavajoNepaleseNew ZealanderNicaraguanNigerianNorthern EuropeanNorwegianOkinawanOsageOttawaPaiutePakistaniPalestinianPanamanianParaguayanPennsylvania GermanPeruvianPimaPolishPortuguesePotawatomiPuebloPuerto RicanPuget Sound SalishRomanianRussianSalvadoranSamoanScandinavianScotch-IrishScottishSeminoleSenegaleseSerbianShoshoneSierra LeoneanSiouxSlavicSlovakSloveneSomaliSouth AfricanSouth AmericanSouth American IndianSoviet UnionSpaniardSpanishSpanish AmericanSpanish American IndianSri LankanSubsaharan AfricanSudaneseSwedishSwissSyrianTaiwaneseThaiTlingit-HaidaTohono O'OdhamTonganTrinidadian and TobagonianTsimshianTurkishU.S. Virgin IslanderUgandanUkrainianUruguayanUteVenezuelanVietnameseWelshWest IndianYakamaYaquiYugoslavianYumanYup'ikZimbabwean
Immigration
NonimmigrantsImmigrantsAfricaAlbaniaArgentinaArmeniaAsiaAustraliaAustriaBahamasBangladeshBarbadosBelarusBelgiumBelizeBoliviaBosnia and HerzegovinaBrazilBulgariaBurma/MyanmarCabo VerdeCambodiaCameroonCanadaCaribbeanCentral AmericaChileChinaColombiaCongoCosta RicaCroatiaCubaCzechoslovakiaDenmarkDominicaDominican RepublicEastern AfricaEastern AsiaEastern EuropeEcuadorEgyptEl SalvadorEnglandEritreaEthiopiaEuropeFijiFranceGermanyGhanaGreeceGrenadaGuatemalaGuyanaHaitiHondurasHong KongHungaryIndiaIndonesiaIranIraqIrelandIsraelItalyJamaicaJapanJordanKazakhstanKenyaKoreaKuwaitLaosLatin AmericaLatviaLebanonLiberiaLithuaniaMalaysiaMexicoMicronesiaMiddle AfricaMoldovaMoroccoNepalNetherlandsNicaraguaNigeriaNorth AmericaNorth MacedoniaNorthern AfricaNorthern EuropeNorwayOceaniaPakistanPanamaPeruPhilippinesPolandPortugalRomaniaRussiaSaudi ArabiaScotlandSenegalSerbiaSierra LeoneSingaporeSomaliaSouth AfricaSouth AmericaSouth Central AsiaSouth Eastern AsiaSouthern EuropeSpainSri LankaSt. Vincent and the GrenadinesSudanSwedenSwitzerlandSyriaTaiwanThailandTrinidad and TobagoTurkeyUgandaUkraineUruguayUzbekistanVenezuelaVietnamWest IndiesWestern AfricaWestern AsiaWestern EuropeYemenZaireZimbabweAzores
Immigrants from Afghanistan
Race
Ancestry
AfghanAlaska NativeAlaskan AthabascanAlbanianAleutAlsatianAmericanApacheArabArapahoArgentineanArmenianAssyrian/Chaldean/SyriacAustralianAustrianBahamianBangladeshiBarbadianBasqueBelgianBelizeanBermudanBhutaneseBlackfeetBolivianBrazilianBritishBritish West IndianBulgarianBurmeseCajunCambodianCanadianCape VerdeanCarpatho RusynCelticCentral AmericanCentral American IndianCherokeeCheyenneChickasawChileanChineseChippewaChoctawColombianColvilleComancheCosta RicanCreeCreekCroatianCrowCubanCypriotCzechCzechoslovakianDanishDelawareDominicanDutchDutch West IndianEastern EuropeanEcuadorianEgyptianEnglishEstonianEthiopianEuropeanFijianFilipinoFinnishFrenchFrench American IndianFrench CanadianGermanGerman RussianGhanaianGreekGuamanian/ChamorroGuatemalanGuyaneseHaitianHmongHonduranHopiHoumaHungarianIcelanderIndian (Asian)IndonesianInupiatIranianIraqiIrishIroquoisIsraeliItalianJamaicanJapaneseJordanianKenyanKiowaKoreanLaotianLatvianLebaneseLiberianLithuanianLumbeeLuxembourgerMacedonianMalaysianMalteseMarshalleseMenomineeMexicanMexican American IndianMongolianMoroccanNative HawaiianNavajoNepaleseNew ZealanderNicaraguanNigerianNorthern EuropeanNorwegianOkinawanOsageOttawaPaiutePakistaniPalestinianPanamanianParaguayanPennsylvania GermanPeruvianPimaPolishPortuguesePotawatomiPuebloPuerto RicanPuget Sound SalishRomanianRussianSalvadoranSamoanScandinavianScotch-IrishScottishSeminoleSenegaleseSerbianShoshoneSierra LeoneanSiouxSlavicSlovakSloveneSomaliSouth AfricanSouth AmericanSouth American IndianSoviet UnionSpaniardSpanishSpanish AmericanSpanish American IndianSri LankanSubsaharan AfricanSudaneseSwedishSwissSyrianTaiwaneseThaiTlingit-HaidaTohono O'OdhamTonganTrinidadian and TobagonianTsimshianTurkishU.S. Virgin IslanderUgandanUkrainianUruguayanUteVenezuelanVietnameseWelshWest IndianYakamaYaquiYugoslavianYumanYup'ikZimbabwean
Immigration
NonimmigrantsImmigrantsAfghanistanAfricaAlbaniaArgentinaArmeniaAsiaAustraliaAustriaBahamasBangladeshBarbadosBelarusBelgiumBelizeBoliviaBosnia and HerzegovinaBrazilBulgariaBurma/MyanmarCabo VerdeCambodiaCameroonCanadaCaribbeanCentral AmericaChileChinaColombiaCongoCosta RicaCroatiaCubaCzechoslovakiaDenmarkDominicaDominican RepublicEastern AfricaEastern AsiaEastern EuropeEcuadorEgyptEl SalvadorEnglandEritreaEthiopiaEuropeFijiFranceGermanyGhanaGreeceGrenadaGuatemalaGuyanaHaitiHondurasHong KongHungaryIndiaIndonesiaIranIraqIrelandIsraelItalyJamaicaJapanJordanKazakhstanKenyaKoreaKuwaitLaosLatin AmericaLatviaLebanonLiberiaLithuaniaMalaysiaMexicoMicronesiaMiddle AfricaMoldovaMoroccoNepalNetherlandsNicaraguaNigeriaNorth AmericaNorth MacedoniaNorthern AfricaNorthern EuropeNorwayOceaniaPakistanPanamaPeruPhilippinesPolandPortugalRomaniaRussiaSaudi ArabiaScotlandSenegalSerbiaSierra LeoneSingaporeSomaliaSouth AfricaSouth AmericaSouth Central AsiaSouth Eastern AsiaSouthern EuropeSpainSri LankaSt. Vincent and the GrenadinesSudanSwedenSwitzerlandSyriaTaiwanThailandTrinidad and TobagoTurkeyUgandaUkraineUruguayUzbekistanVenezuelaVietnamWest IndiesWestern AfricaWestern AsiaWestern EuropeYemenZaireZimbabweAzores
In Labor Force | Age 45-54
Income
Poverty
Unemployment
Labor Participation
Family Structure
Vehicle Availability
Education Level
Disability

In Labor Force | Age 45-54 Comparison

Africans

Immigrants from Afghanistan

Tragic
Exceptional
80.5%
IN LABOR FORCE | AGE 45-54
0.0/ 100
METRIC RATING
296th/ 347
METRIC RANK
83.2%
IN LABOR FORCE | AGE 45-54
92.4/ 100
METRIC RATING
112th/ 347
METRIC RANK

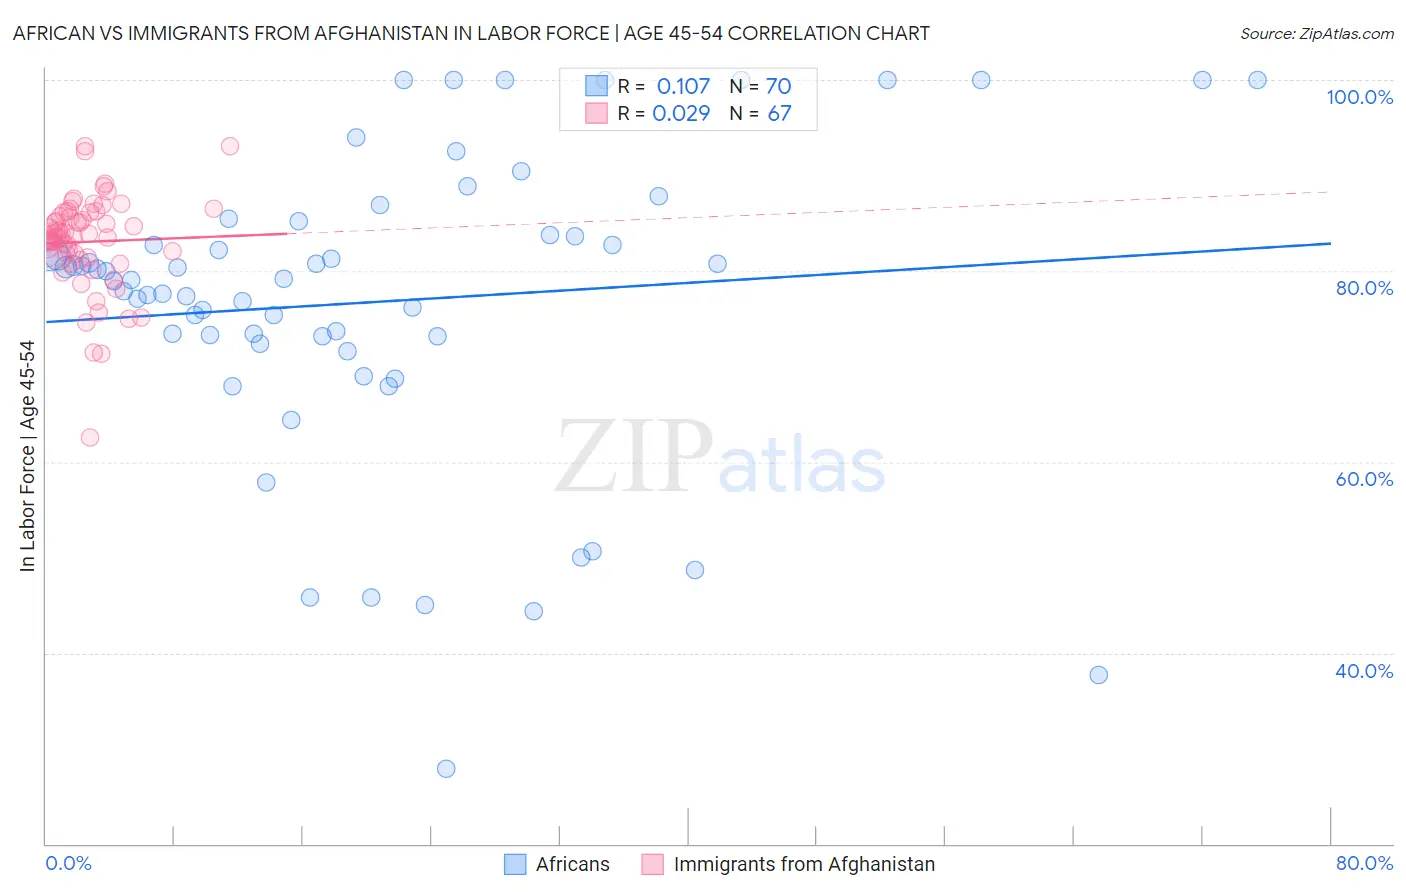
African vs Immigrants from Afghanistan In Labor Force | Age 45-54 Correlation Chart

The statistical analysis conducted on geographies consisting of 469,587,122 people shows a poor positive correlation between the proportion of Africans and labor force participation rate among population between the ages 45 and 54 in the United States with a correlation coefficient (R) of 0.107 and weighted average of 80.5%. Similarly, the statistical analysis conducted on geographies consisting of 147,633,155 people shows no correlation between the proportion of Immigrants from Afghanistan and labor force participation rate among population between the ages 45 and 54 in the United States with a correlation coefficient (R) of 0.029 and weighted average of 83.2%, a difference of 3.4%.
African vs Immigrants from Afghanistan In Labor Force | Age 45-54

In Labor Force | Age 45-54 Correlation Summary

MeasurementAfricanImmigrants from Afghanistan
Minimum27.9%62.6%
Maximum100.0%93.1%
Range72.1%30.5%
Mean76.8%83.0%
Median79.1%83.6%
Interquartile 25% (IQ1)73.2%81.4%
Interquartile 75% (IQ3)83.8%86.1%
Interquartile Range (IQR)10.6%4.7%
Standard Deviation (Sample)15.9%5.0%
Standard Deviation (Population)15.8%5.0%

Similar Demographics by In Labor Force | Age 45-54

Demographics Similar to Africans by In Labor Force | Age 45-54

In terms of in labor force | age 45-54, the demographic groups most similar to Africans are Nepalese (80.5%, a difference of 0.040%), Osage (80.6%, a difference of 0.10%), Yakama (80.6%, a difference of 0.10%), Iroquois (80.6%, a difference of 0.12%), and Immigrants from Belize (80.6%, a difference of 0.15%).
DemographicsRating | RankIn Labor Force | Age 45-54
Immigrants | Bangladesh
0.0
/100
|
#289
Tragic
80.7%
Mexican American Indians
0.0
/100
|
#290
Tragic
80.7%
Immigrants | Belize
0.0
/100
|
#291
Tragic
80.6%
Iroquois
0.0
/100
|
#292
Tragic
80.6%
Osage
0.0
/100
|
#293
Tragic
80.6%
Yakama
0.0
/100
|
#294
Tragic
80.6%
Nepalese
0.0
/100
|
#295
Tragic
80.5%
Africans
0.0
/100
|
#296
Tragic
80.5%
Americans
0.0
/100
|
#297
Tragic
80.4%
Marshallese
0.0
/100
|
#298
Tragic
80.3%
Dominicans
0.0
/100
|
#299
Tragic
80.3%
Fijians
0.0
/100
|
#300
Tragic
80.2%
Spanish American Indians
0.0
/100
|
#301
Tragic
80.2%
Immigrants | Central America
0.0
/100
|
#302
Tragic
80.2%
Immigrants | Azores
0.0
/100
|
#303
Tragic
80.1%

Demographics Similar to Immigrants from Afghanistan by In Labor Force | Age 45-54

In terms of in labor force | age 45-54, the demographic groups most similar to Immigrants from Afghanistan are Immigrants from Italy (83.2%, a difference of 0.0%), Slovak (83.2%, a difference of 0.010%), Ukrainian (83.2%, a difference of 0.010%), Immigrants from Africa (83.2%, a difference of 0.010%), and Iranian (83.2%, a difference of 0.020%).
DemographicsRating | RankIn Labor Force | Age 45-54
Immigrants | South America
93.5
/100
|
#105
Exceptional
83.2%
Sri Lankans
93.2
/100
|
#106
Exceptional
83.2%
Iranians
92.9
/100
|
#107
Exceptional
83.2%
Slovaks
92.8
/100
|
#108
Exceptional
83.2%
Ukrainians
92.7
/100
|
#109
Exceptional
83.2%
Immigrants | Africa
92.6
/100
|
#110
Exceptional
83.2%
Immigrants | Italy
92.5
/100
|
#111
Exceptional
83.2%
Immigrants | Afghanistan
92.4
/100
|
#112
Exceptional
83.2%
Immigrants | Albania
91.8
/100
|
#113
Exceptional
83.2%
Assyrians/Chaldeans/Syriacs
91.7
/100
|
#114
Exceptional
83.2%
Immigrants | Chile
91.6
/100
|
#115
Exceptional
83.2%
Immigrants | Malaysia
91.4
/100
|
#116
Exceptional
83.2%
Immigrants | China
90.9
/100
|
#117
Exceptional
83.2%
Immigrants | Europe
90.7
/100
|
#118
Exceptional
83.2%
Immigrants | Uruguay
90.2
/100
|
#119
Exceptional
83.2%