Guatemalan vs Immigrants from Haiti In Labor Force | Age 20-24
COMPARE
Guatemalan
Immigrants from Haiti
In Labor Force | Age 20-24
In Labor Force | Age 20-24 Comparison
Guatemalans
Immigrants from Haiti
75.3%
IN LABOR FORCE | AGE 20-24
72.3/ 100
METRIC RATING
153rd/ 347
METRIC RANK
73.6%
IN LABOR FORCE | AGE 20-24
0.5/ 100
METRIC RATING
264th/ 347
METRIC RANK
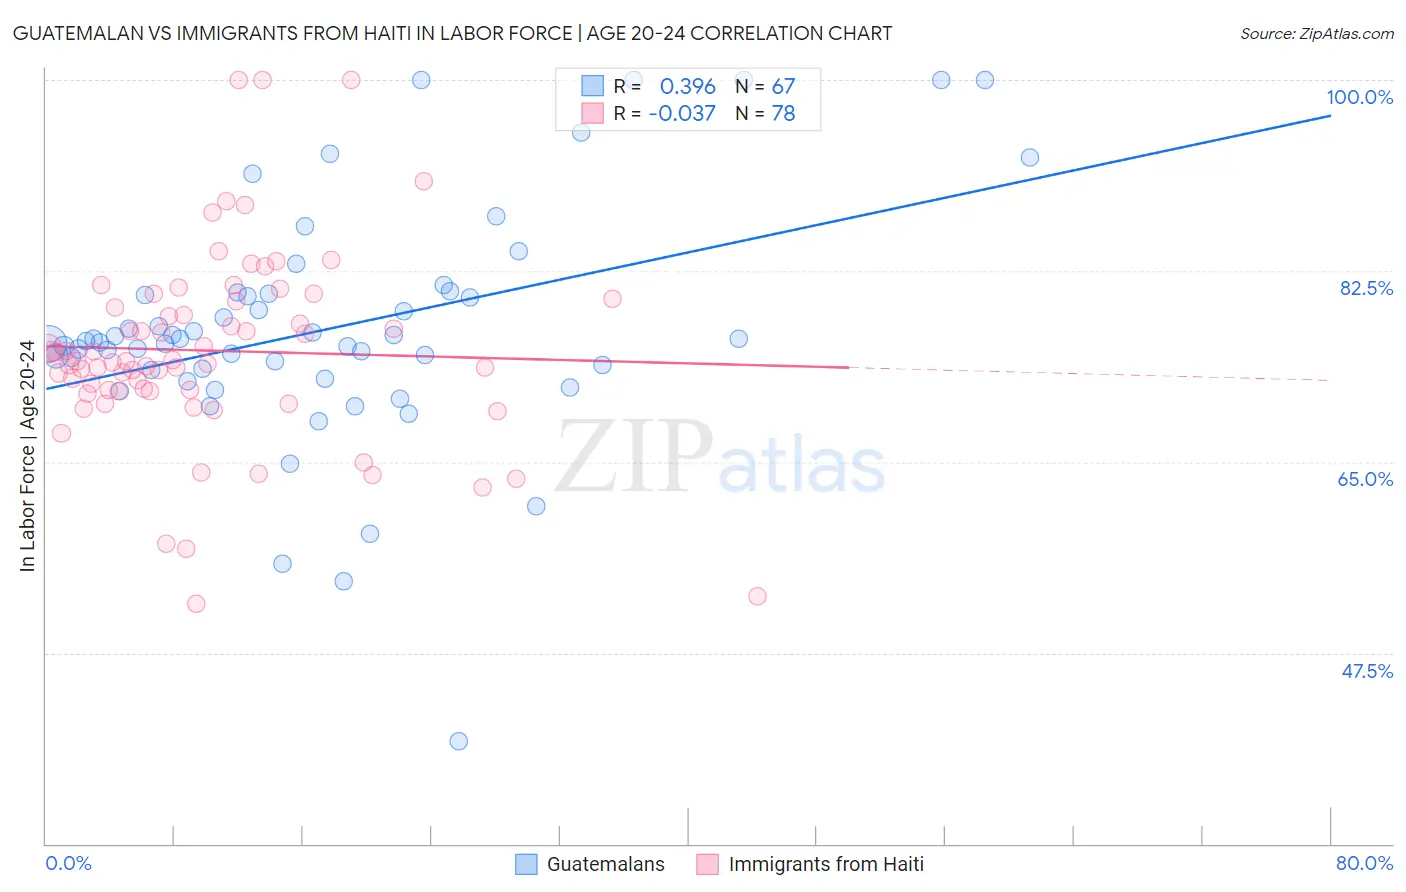
Guatemalan vs Immigrants from Haiti In Labor Force | Age 20-24 Correlation Chart
The statistical analysis conducted on geographies consisting of 409,475,190 people shows a mild positive correlation between the proportion of Guatemalans and labor force participation rate among population between the ages 20 and 24 in the United States with a correlation coefficient (R) of 0.396 and weighted average of 75.3%. Similarly, the statistical analysis conducted on geographies consisting of 225,234,357 people shows no correlation between the proportion of Immigrants from Haiti and labor force participation rate among population between the ages 20 and 24 in the United States with a correlation coefficient (R) of -0.037 and weighted average of 73.6%, a difference of 2.4%.
In Labor Force | Age 20-24 Correlation Summary
| Measurement | Guatemalan | Immigrants from Haiti |
| Minimum | 39.4% | 52.0% |
| Maximum | 100.0% | 100.0% |
| Range | 60.6% | 48.0% |
| Mean | 77.2% | 75.2% |
| Median | 76.1% | 74.2% |
| Interquartile 25% (IQ1) | 73.4% | 71.5% |
| Interquartile 75% (IQ3) | 80.4% | 79.8% |
| Interquartile Range (IQR) | 7.0% | 8.3% |
| Standard Deviation (Sample) | 10.8% | 8.9% |
| Standard Deviation (Population) | 10.7% | 8.8% |
Similar Demographics by In Labor Force | Age 20-24
Demographics Similar to Guatemalans by In Labor Force | Age 20-24
In terms of in labor force | age 20-24, the demographic groups most similar to Guatemalans are Osage (75.3%, a difference of 0.0%), Immigrants from Guatemala (75.3%, a difference of 0.010%), Immigrants from El Salvador (75.3%, a difference of 0.010%), Immigrants from Western Europe (75.3%, a difference of 0.010%), and Lebanese (75.3%, a difference of 0.020%).
| Demographics | Rating | Rank | In Labor Force | Age 20-24 |
| Mexican American Indians | 78.8 /100 | #146 | Good 75.4% |
| Comanche | 77.6 /100 | #147 | Good 75.4% |
| Immigrants | Cambodia | 76.7 /100 | #148 | Good 75.4% |
| Ugandans | 76.1 /100 | #149 | Good 75.4% |
| Salvadorans | 74.8 /100 | #150 | Good 75.3% |
| Paiute | 74.1 /100 | #151 | Good 75.3% |
| Lebanese | 73.5 /100 | #152 | Good 75.3% |
| Guatemalans | 72.3 /100 | #153 | Good 75.3% |
| Osage | 72.3 /100 | #154 | Good 75.3% |
| Immigrants | Guatemala | 71.9 /100 | #155 | Good 75.3% |
| Immigrants | El Salvador | 71.7 /100 | #156 | Good 75.3% |
| Immigrants | Western Europe | 71.5 /100 | #157 | Good 75.3% |
| Immigrants | Bolivia | 71.0 /100 | #158 | Good 75.3% |
| South American Indians | 69.0 /100 | #159 | Good 75.3% |
| Japanese | 68.7 /100 | #160 | Good 75.3% |
Demographics Similar to Immigrants from Haiti by In Labor Force | Age 20-24
In terms of in labor force | age 20-24, the demographic groups most similar to Immigrants from Haiti are Immigrants from Asia (73.6%, a difference of 0.010%), Burmese (73.6%, a difference of 0.010%), Haitian (73.6%, a difference of 0.020%), Immigrants from Western Asia (73.5%, a difference of 0.050%), and Asian (73.7%, a difference of 0.090%).
| Demographics | Rating | Rank | In Labor Force | Age 20-24 |
| Paraguayans | 0.8 /100 | #257 | Tragic 73.7% |
| Egyptians | 0.7 /100 | #258 | Tragic 73.7% |
| Dutch West Indians | 0.7 /100 | #259 | Tragic 73.7% |
| Immigrants | Turkey | 0.7 /100 | #260 | Tragic 73.7% |
| Houma | 0.6 /100 | #261 | Tragic 73.7% |
| Asians | 0.6 /100 | #262 | Tragic 73.7% |
| Immigrants | Asia | 0.5 /100 | #263 | Tragic 73.6% |
| Immigrants | Haiti | 0.5 /100 | #264 | Tragic 73.6% |
| Burmese | 0.5 /100 | #265 | Tragic 73.6% |
| Haitians | 0.5 /100 | #266 | Tragic 73.6% |
| Immigrants | Western Asia | 0.4 /100 | #267 | Tragic 73.5% |
| South Americans | 0.4 /100 | #268 | Tragic 73.5% |
| Colombians | 0.3 /100 | #269 | Tragic 73.5% |
| Immigrants | Russia | 0.3 /100 | #270 | Tragic 73.5% |
| Immigrants | Indonesia | 0.3 /100 | #271 | Tragic 73.4% |