Guatemalan vs Alsatian In Labor Force | Age 20-24
COMPARE
Guatemalan
Alsatian
In Labor Force | Age 20-24
In Labor Force | Age 20-24 Comparison
Guatemalans
Alsatians
75.3%
IN LABOR FORCE | AGE 20-24
72.3/ 100
METRIC RATING
153rd/ 347
METRIC RANK
74.8%
IN LABOR FORCE | AGE 20-24
27.1/ 100
METRIC RATING
193rd/ 347
METRIC RANK
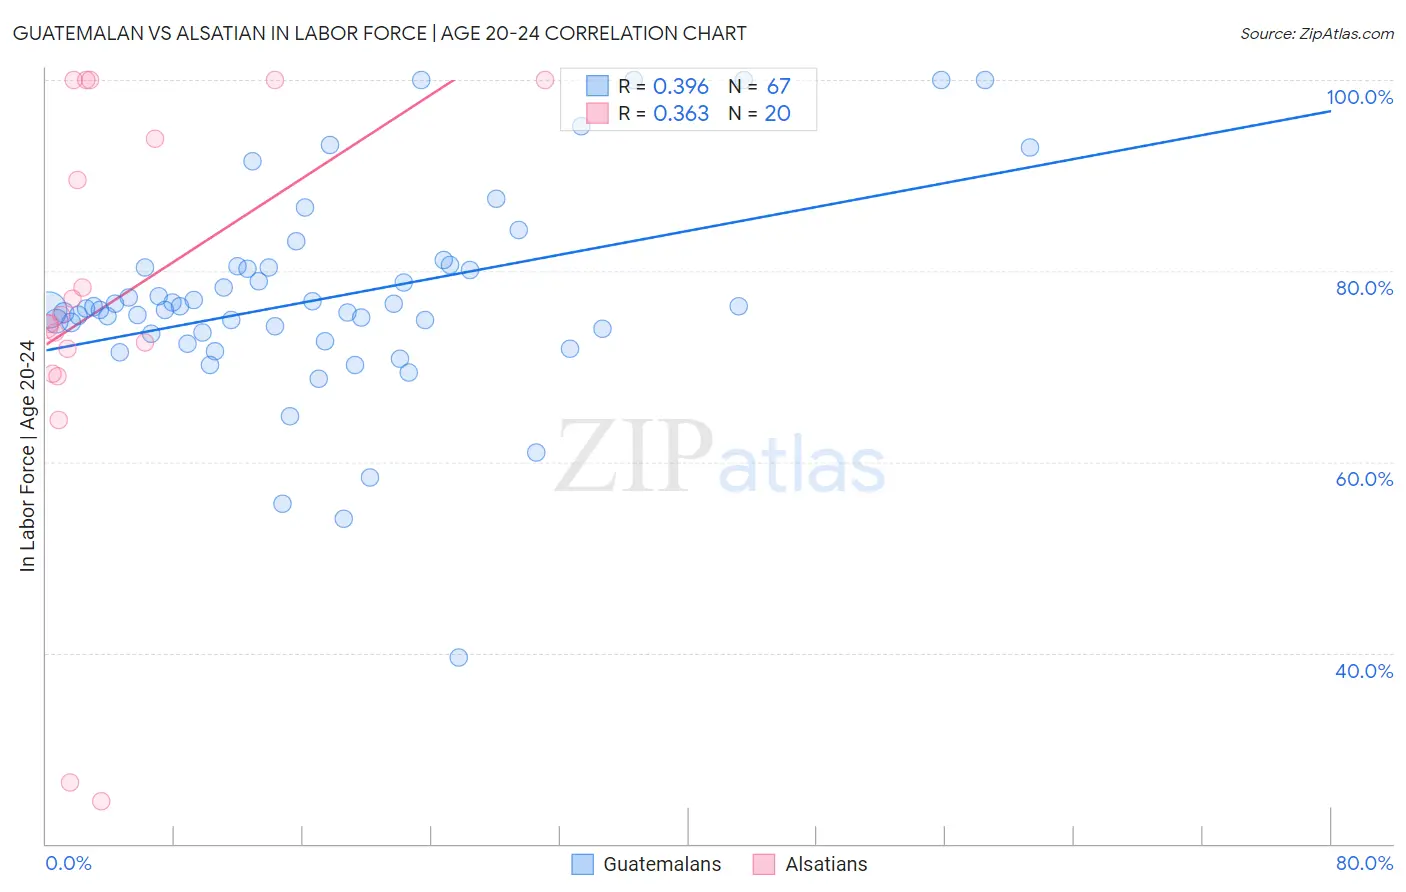
Guatemalan vs Alsatian In Labor Force | Age 20-24 Correlation Chart
The statistical analysis conducted on geographies consisting of 409,475,190 people shows a mild positive correlation between the proportion of Guatemalans and labor force participation rate among population between the ages 20 and 24 in the United States with a correlation coefficient (R) of 0.396 and weighted average of 75.3%. Similarly, the statistical analysis conducted on geographies consisting of 82,637,215 people shows a mild positive correlation between the proportion of Alsatians and labor force participation rate among population between the ages 20 and 24 in the United States with a correlation coefficient (R) of 0.363 and weighted average of 74.8%, a difference of 0.72%.
In Labor Force | Age 20-24 Correlation Summary
| Measurement | Guatemalan | Alsatian |
| Minimum | 39.4% | 24.4% |
| Maximum | 100.0% | 100.0% |
| Range | 60.6% | 75.6% |
| Mean | 77.2% | 76.7% |
| Median | 76.1% | 74.9% |
| Interquartile 25% (IQ1) | 73.4% | 70.5% |
| Interquartile 75% (IQ3) | 80.4% | 97.0% |
| Interquartile Range (IQR) | 7.0% | 26.5% |
| Standard Deviation (Sample) | 10.8% | 21.5% |
| Standard Deviation (Population) | 10.7% | 20.9% |
Similar Demographics by In Labor Force | Age 20-24
Demographics Similar to Guatemalans by In Labor Force | Age 20-24
In terms of in labor force | age 20-24, the demographic groups most similar to Guatemalans are Osage (75.3%, a difference of 0.0%), Immigrants from Guatemala (75.3%, a difference of 0.010%), Immigrants from El Salvador (75.3%, a difference of 0.010%), Immigrants from Western Europe (75.3%, a difference of 0.010%), and Lebanese (75.3%, a difference of 0.020%).
| Demographics | Rating | Rank | In Labor Force | Age 20-24 |
| Mexican American Indians | 78.8 /100 | #146 | Good 75.4% |
| Comanche | 77.6 /100 | #147 | Good 75.4% |
| Immigrants | Cambodia | 76.7 /100 | #148 | Good 75.4% |
| Ugandans | 76.1 /100 | #149 | Good 75.4% |
| Salvadorans | 74.8 /100 | #150 | Good 75.3% |
| Paiute | 74.1 /100 | #151 | Good 75.3% |
| Lebanese | 73.5 /100 | #152 | Good 75.3% |
| Guatemalans | 72.3 /100 | #153 | Good 75.3% |
| Osage | 72.3 /100 | #154 | Good 75.3% |
| Immigrants | Guatemala | 71.9 /100 | #155 | Good 75.3% |
| Immigrants | El Salvador | 71.7 /100 | #156 | Good 75.3% |
| Immigrants | Western Europe | 71.5 /100 | #157 | Good 75.3% |
| Immigrants | Bolivia | 71.0 /100 | #158 | Good 75.3% |
| South American Indians | 69.0 /100 | #159 | Good 75.3% |
| Japanese | 68.7 /100 | #160 | Good 75.3% |
Demographics Similar to Alsatians by In Labor Force | Age 20-24
In terms of in labor force | age 20-24, the demographic groups most similar to Alsatians are Immigrants from Europe (74.8%, a difference of 0.010%), Senegalese (74.8%, a difference of 0.020%), Immigrants from Denmark (74.8%, a difference of 0.030%), Eastern European (74.8%, a difference of 0.030%), and Immigrants from Vietnam (74.7%, a difference of 0.040%).
| Demographics | Rating | Rank | In Labor Force | Age 20-24 |
| Immigrants | Eastern Europe | 33.8 /100 | #186 | Fair 74.9% |
| Immigrants | Honduras | 33.5 /100 | #187 | Fair 74.9% |
| Hondurans | 32.7 /100 | #188 | Fair 74.8% |
| Immigrants | Northern Europe | 32.6 /100 | #189 | Fair 74.8% |
| Russians | 32.2 /100 | #190 | Fair 74.8% |
| Senegalese | 28.1 /100 | #191 | Fair 74.8% |
| Immigrants | Europe | 27.5 /100 | #192 | Fair 74.8% |
| Alsatians | 27.1 /100 | #193 | Fair 74.8% |
| Immigrants | Denmark | 25.8 /100 | #194 | Fair 74.8% |
| Eastern Europeans | 25.4 /100 | #195 | Fair 74.8% |
| Immigrants | Vietnam | 25.1 /100 | #196 | Fair 74.7% |
| Panamanians | 25.0 /100 | #197 | Fair 74.7% |
| Immigrants | Nigeria | 24.2 /100 | #198 | Fair 74.7% |
| Taiwanese | 23.2 /100 | #199 | Fair 74.7% |
| Nigerians | 21.9 /100 | #200 | Fair 74.7% |